Jon Bruner from Forbes.com has designed and posted an interactive timeline/map of the major investments China has made all over the world in the last five years.
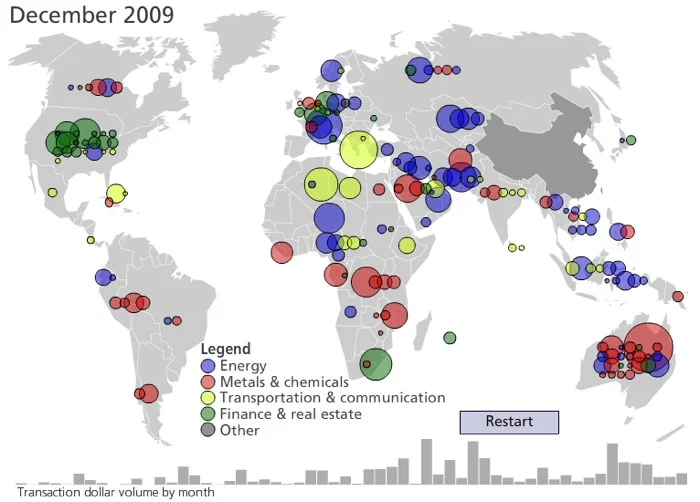
When you first see the map, it’s an animated timeline that highlights which countries China invested in each month since March 2005. The animation completes when it reaches December 2009, and then you can select a particular year by clicking on the total investment bars across the bottom or see the details behind any particular investment by mousing over one of the bubbles. The bubble sizes represent the size of the investments.
Since 2005 Chinese firms and arms of the Chinese government have invested hundreds of billions of dollars in foreign companies and raw materials. Each dot on this map tracks one of those investments, with larger dots representing larger investments. Explore the map by rolling over and clicking on the dots and timeline.
Thanks Jon for the link!