


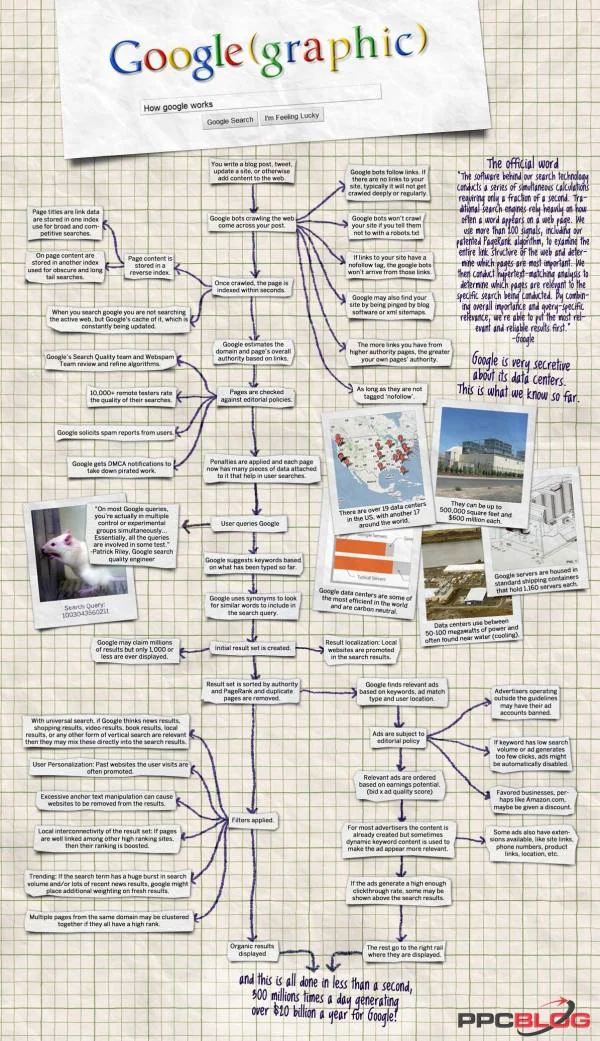
Google(graphic) - How Google Works
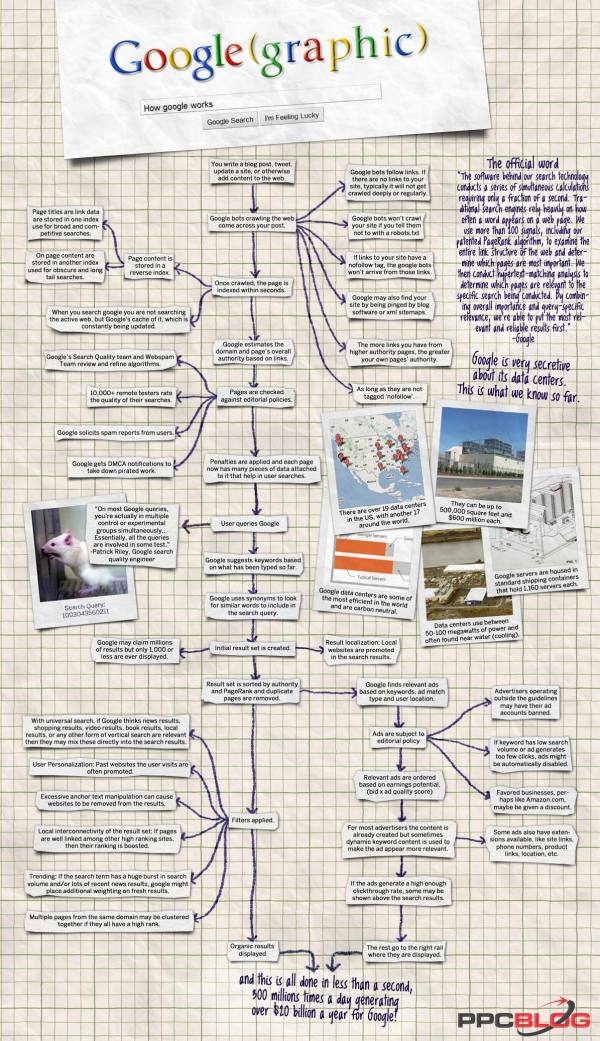
PPCblog.com brings us the Google(graphic) flowchart that documents what happens in the fraction of a second after 300 million people press the Search button every day. Created by infographic designer Jess Bachman at WallStats.com.
So here is my latest infographic, hot off the press. How Google Works. It’s a flow type chart that diagrams the process of how google gets it data and what happens in the second after you search. It’s a $20 billion a year process for google, and pretty interesting.


