Top Reasons Startups Fail
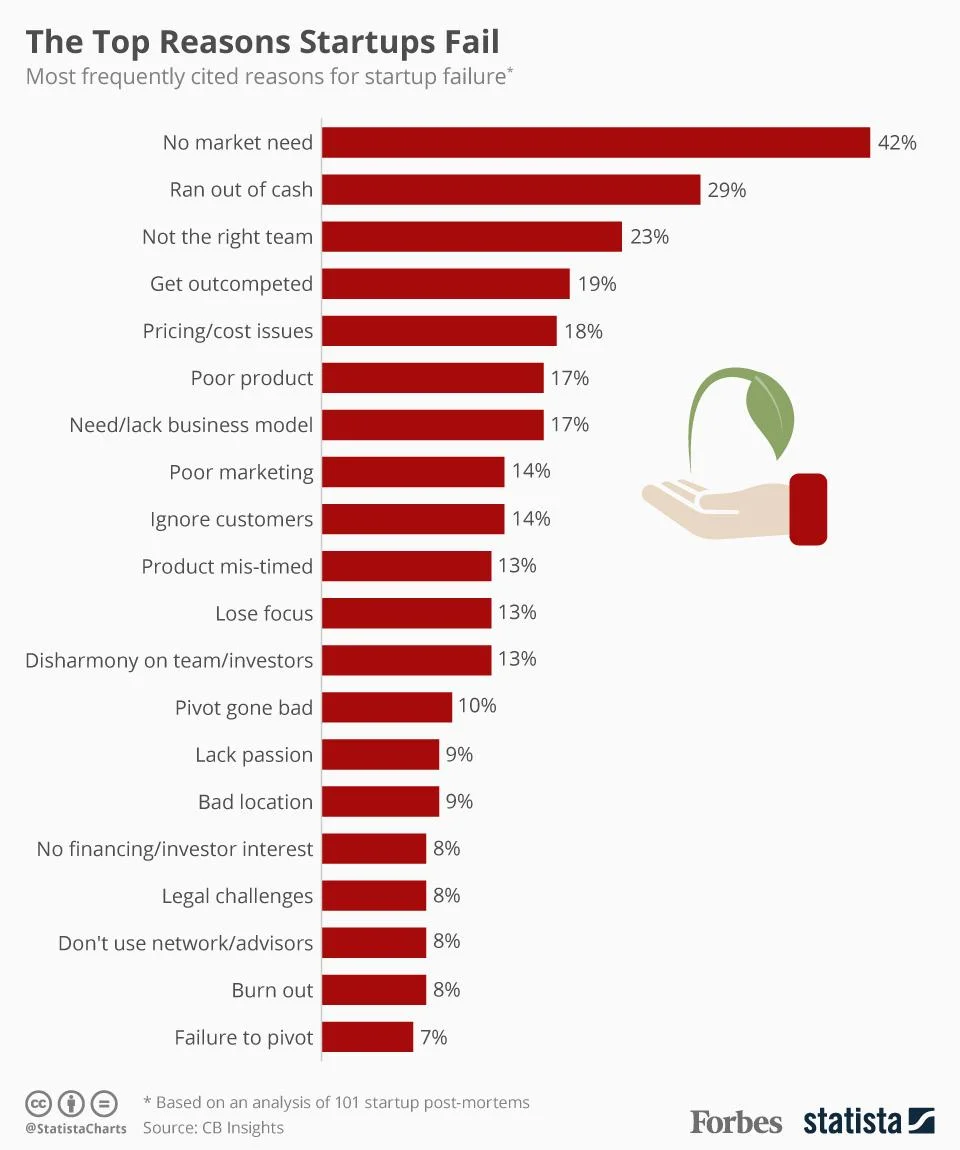
It takes more than just a good idea for a startup to succeed. Forbes analyzed 101 failed startups and found that The Top Reason Startups Fail, was the lack of need for their product. Launching a startup takes a lot of preparation and research. Make sure you are fully prepared before starting your own.
Down through the years, some startups really struck gold. When Accel Partners invested $14.8 million in a website called "thefacebook.com" back in 2005, they made a return of $5.6 billion - 378 times their original outlay. More often than not, however, startups tend to fail brutally. According to CB Insights, 70 percent of upstart tech companies fail, usually about 20 months after first raising financing. The failure rate is even worse for consumer hardware startups with 97 percent of seed crowdfunded companies failing or turning into "zombies".
CB Insights delved into a compilation of startup failure post-mortems by founders and investors to shed light on why many ventures grind to a halt. The following infographic shows the top-20 cited reasons for failure with products or services that do not serve a market need in first position. Not all startups are lucky enough to attract financial backing as lucrative as Accel Partners' investment in Facebook; in 29 percent of cases, they simply run out of cash. Having the right people onboard from the outset can make a massive difference when it comes to success and ploughing ahead without the right team is the third most frequently cited reason for a startup ending in failure.
For a good infographic, sometimes all you need is a nice clean chart. This design uses a simple bar chart to clearly visualize the data. No gridlines. No axis titles. No value axis labels. No chart legend! It's a horizontal bar chart to allow room for the text labels to be easily read by the audience. All of the information needed is displayed directly in the chart itself.
Found on Forbes.


