NCAA 2018 - Basketball Shot Visualisation
The team at ItoWorld has animated the data from the 2018 NCAA Basketball season into this fun Basketball Shot Visualization video of all of the made baskets and where on the court the shots were taken.
Fun Friday #Sportsviz! My evenings have taken me down another sports-related rabbit hole, this time using basketball shot data from the NCAA.
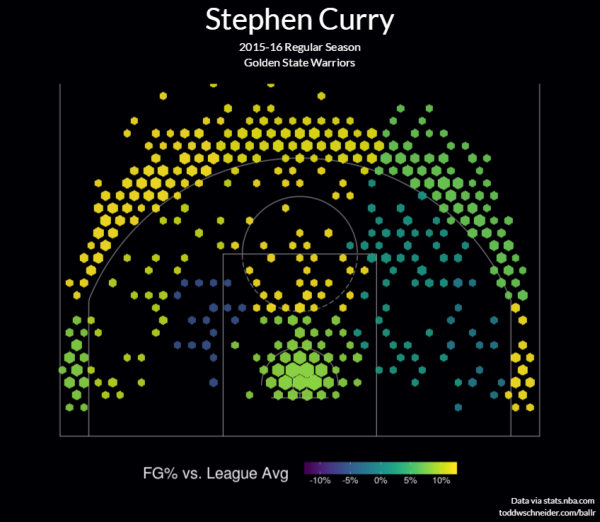
This visualisation shows all 'scored' points colour coded by the value of the point and visualised over the timespan of a game (many games here!) Data is filtered for just 2018 games, the whole dataset has roughly 4million points from dates back to 2013.
Design-wise the arcs aren't meant to be accurate traces of the shot, just an abstract view of where the point was scored from. Finally, an accumulating hex grid shows the overall pattern of shots taken.
This was a lot of fun to make! All made using out Ito World design tools and the dataset was pulled from here: console.cloud.google.com/marketplace/details/ncaa-bb-public/ncaa-basketball
I appreciate the link to the data source!
Link found by Column Five Media