Gauge chart reference: How to configure gauge charts.
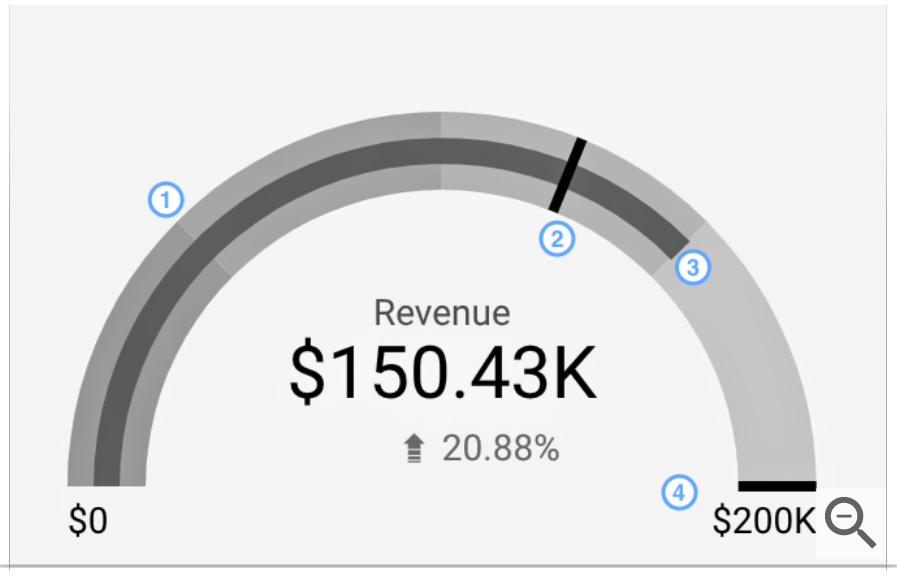
Gauge charts in Data Studio visualize a single metric. You can optionally display a minimum and maximum value, target value, comparison value, and set up to 5 ranges. You can also change the chart colors, and apply data filters.
Read more at Gauge chart reference - Data Studio Help (google.com)