
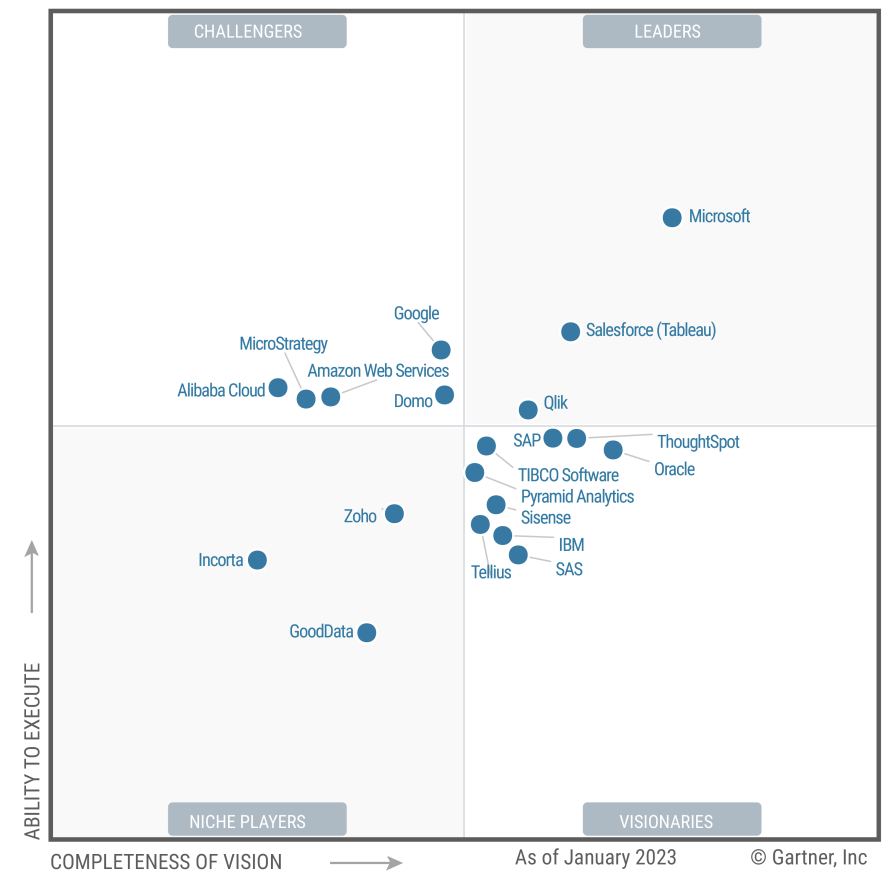
Gartner 2023 Analytics and BI Platforms Magic Quadrant
Gartner calls these “Analytics and Business Intelligence Platforms” in their annual Magic Quadrant report. They all offer a combination of database management, analytics and data visualization capabilities.
They all use data connectors to gain access to data live data sources like SQL databases or website analytics, or you can also upload static data from Excel and CSV files. You can build interactive dashboards using the built-in chart types, and some of them allow you import additional custom chart types.

Leave chart builders behind. Live visual analytics fuel unlimited data exploration. Interactive dashboards help you uncover hidden insights on the fly. Tableau harnesses people’s natural ability to spot visual patterns quickly, revealing everyday opportunities and eureka moments alike. Try Tableau Public for FREE using static data from an Excel or CSV file.
Power BI is a business analytics service that delivers insights to enable fast, informed decisions. Download a FREE Trial of Power BI Desktop.
Transform data into stunning visuals and share them with colleagues on any device.
Visually explore and analyze data—on-premises and in the cloud—all in one view.
Collaborate on and share customized dashboards and interactive reports.
With intuitive, user-friendly tools for data discovery, data visualization, data wrangling, advanced big data analytics, and more, MicroStrategy gives every user, regardless of technical skill, the ability to find the answers they need—whether it’s via web, mobile, or desktop. With powerful out-of-the-box visualization tools, and the ability to leverage custom and third-party charts, MicroStrategy makes it easy to find key insights and present them for maximum impact. Download Microstrategy Desktop for FREE to get started.

Qlik Sense gives you data superpowers. Easily combine all your data sources, no matter how large, into a single view. Explore, create, and collaborate on any device, directly at the point of decision. Qlik Sense is built from the ground up with responsive mobile design and touch interaction. Build analytics apps once, and they’ll work everywhere, on desktop, tablet, or mobile devices. Try Qlik Sense for FREE with Qlik Sense Cloud or Qlik Sense Desktop for Windows
Interactive data visualizations make deeper analysis simple. With Looker, visualizations are built on fresh data direct from the source and they update in real-time. When you need to know more, you can drill from the visualization into row-level detail. Select a visualization from the Looker library, or build your own.

Sisense builds visual dashboards and reports to express any piece of data, discover underlying trends, and make data-driven decisions. Choose from hundreds of predesigned data visualization widgets, get recommendations on the best ways to view your data, even submit your own open source designs. Watch a Demo or Start a FREE Trial
Geckoboard is a TV dashboard software solution that let’s you pull in your metrics from 60+ code-free integrations, or freestyle with spreadsheets and their datasets API. Choose which metrics you want to show, and fine-tune with a range of visualizations and filters. Customize your dashboard with drag and drop and manage your dashboard display remotely.


