Roberto Rovira, and assistant professor of landscape architecture at the
Florida International University's, School of Architecture
, was kind enough to allow me to share some of his work with the readers of Cool Infographics.
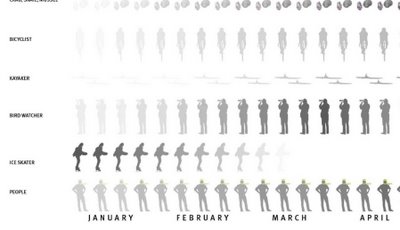
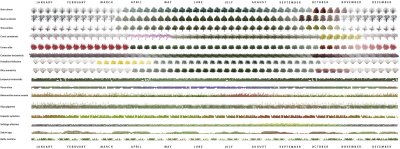
Working as a consultant, these seasonal timelines were developed to show the activities and the plants used in a proposal for a project he led called "Envisioning Hudson Square" on the Hudson River near Manhattan, NY.
The first one shows the time of year that different activities would be active in this green area during the year like bicycling, bird watching and ice skating. It also shows the different wildlife that would be present during the year like blue heron, striped bass and snowy egrets. Using the visual timeline you can see how the different activities overlap and that there would always be some type of activity during the year.
The second timeline from the same project show the proposed plant and trees to be used in the project, and with the use of the visual timeline shows their color and appearance throughout the year.
Graphics by Roberto Rovira, RLA, with assistance from landscape designer Kelly Woodward. Roberto is Assistant Professor in Landscape Architecture at Florida International University (www.fiu.edu/~soa) and Senior Landscape Architect consultant for ArquitectonicaGEO (www.arquitectonicageo.com), a Miami-based landscape and planning firm. He led GEO's design team and developed the concepts for 'Hudson Square Prints Green!', a proposal for a 30-block New York City district on Manhattan's West Side, adjacent to the Hudson River.


