Could You Be a Failure?

Who says an infographic can’t be fun or humorous? Could You Be a Failure? is an infographic with 10 line charts looking at different traits by age. NOT based on any hard-core research, these just show the designer’s perceptions by age.
Designed by Jess Bachman and published by Smarter.org.
Here is some light but insightful infographic fare. Obviously based on no real data but my own wit, but hopefully it will make people think/smile/laugh.
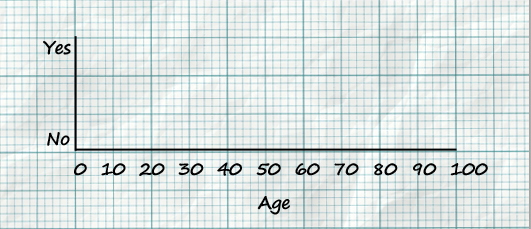
One cool thing is that they included a blank chart for you to create your own. Go ahead and make one for yourself and hang it up at work. People will definitely notice and probably laugh or comment.