Visualizing Daily Activities With Media Wheel

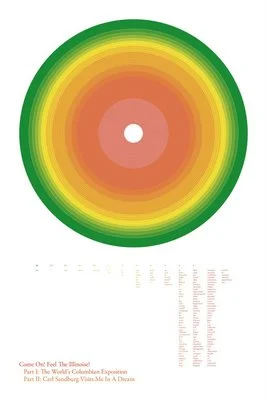
I really like the Media Wheel for Visualizing Daily Activities from Hill Holiday. The wheel visualizes how people consumer different types of media over the course of a day. For example, DVD/Video is mostly consumed in the evening and Newspaper is mostly consumed in the morning. each slice is a different type of media, and the consumption levels are shown by how bright the colors are at that time of day.
For a media planning project, we needed to find a simple way to illustrate how people in a particular segment engage with different media. After some experimentation, we came up with this “media wheel” chart that summarizes 216 data points from a media spreadsheet.
Read their blog post, they included a good description of how they normalized the data and created the media wheel. They also gave credit to the designer, Eric Fensternheim, which is always nice to see.
The wheel graph itself was built by hand in Adobe Illustrator. Each data point’s value relative to the highest in its row is tied to the corresponding level of color transparency.
Design: Eric Fensterheim, media design intern.