Cycling Injuries Revealed Infographic
From the Christensen Law Firm comes the Cycling Injuries Revealed infographic.
From an infographic design standpoint, there are both things I really like and don’t like about this one.
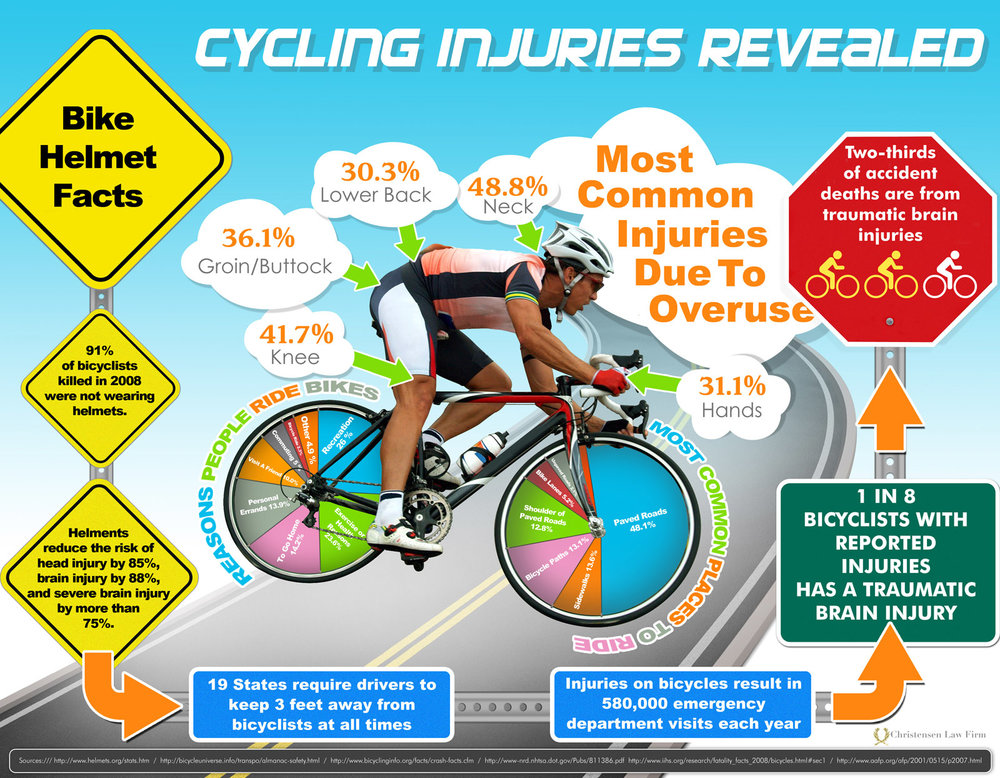
I like that the Most Common Injuries statistics are placed around the rider right near the appropriate area of the body, but I don’t like that the clouds are different sizes with no relation to the percentage values.
I love the pie charts in the bicycle wheels, but the text is too small to read.
I like the use of street signs for the surrounding figures, but they have too much text and those statisitics could have been visualized. The bicycle rider icons in the Stop Sign are a good example of how the rest of the signs should have been designed.
Even the road and sky color in the background helps to make this infographic stand out on a white background nicely.
I love that there is a large, center visual that focuses the readers attention on the primary information.
Thanks to Jake for sending me the link!