The Nearest Stars
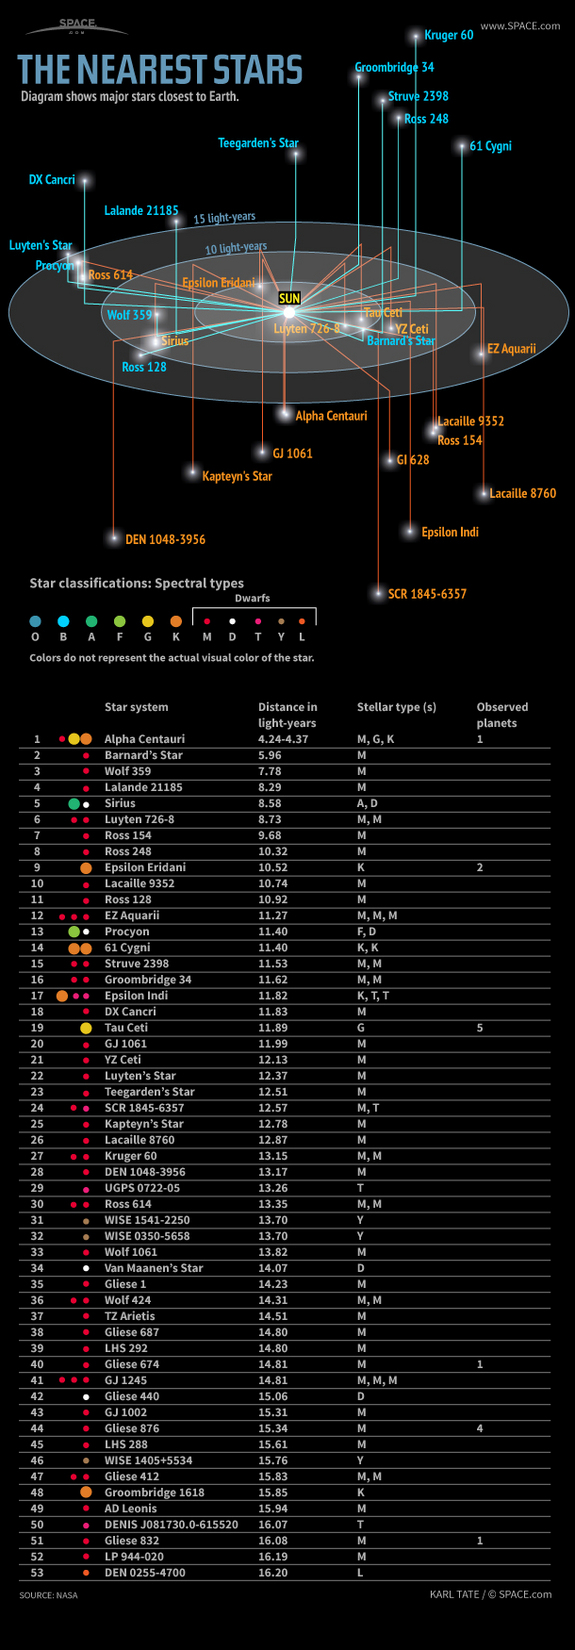
The Nearest Stars infographic from Space tracks the 53 closest stars to the earth. Their classification and distance is also included.
The nearest stars to Earth are in the Alpha Centauri triple-star system, about 4.37 light-years away. One of these stars, Proxima Centauri, is slightly closer, at 4.24 light-years.
Of all the stars closer than 15 light-years, only two are spectral type G, similar to our sun: Alpha Centauri A and Tau Ceti. The majority are M-type red dwarf stars.
Only nine of the stars in this area are bright enough to be seen by the naked human eye from Earth. These brightest stars include Alpha Centauri A and B, Sirius A, Epsilon Eridani, Procyon, 61 Cygni A and B, Epsilon Indi A and Tau Ceti.
Barnard’s Star, a red dwarf 5.96 light-years away, has the largest proper motion of any known star. This means that Barnard’s Star moves rapidly against the background of more distant stars, at a rate of 10.3 seconds of arc per Earth year.
Sirius A is the brightest star in Earth’s night sky, due to its intrinsic brightness and its proximity to us. Sirius B, a white dwarf star, is smaller than Earth but has a mass 98 percent that of our sun.
In late 2012, astronomers discovered that Tau Ceti may host five planets including one within the star’s habitable zone. Tau Ceti is the nearest single G-type star like our sun (although the Alpha Centauri triple-star system also hosts a G-type star and is much closer).
The masses of Tau Ceti’s planets range from between two and six times the mass of Earth.
Great data from Space.com. The infographic focuses on visualizing the distance of the stars from Earth. In that process, it caused some of the visual to be cluttered. It’s always hard to convey 3D information on a 2D image.
From a data visualization standpoint, the lower table is unnecessary. All of that information could have been conveyed in the star map illustration. The color coding of the names in the map doesn’t match the color coding of the star classifications, and that’s confusing to readers. It would have also helped to provide an explanation of why star systems can have multiple classifications.
If they wanted to keep the detailed table below, it should include more visual elements. The stellar types with the classification are redundant and can be combined. The distances could have included bars to show the light years from Earth. The number of observed planets could have used icons.
Found on Visual.ly


