Making America Smarter, Stronger, and Younger
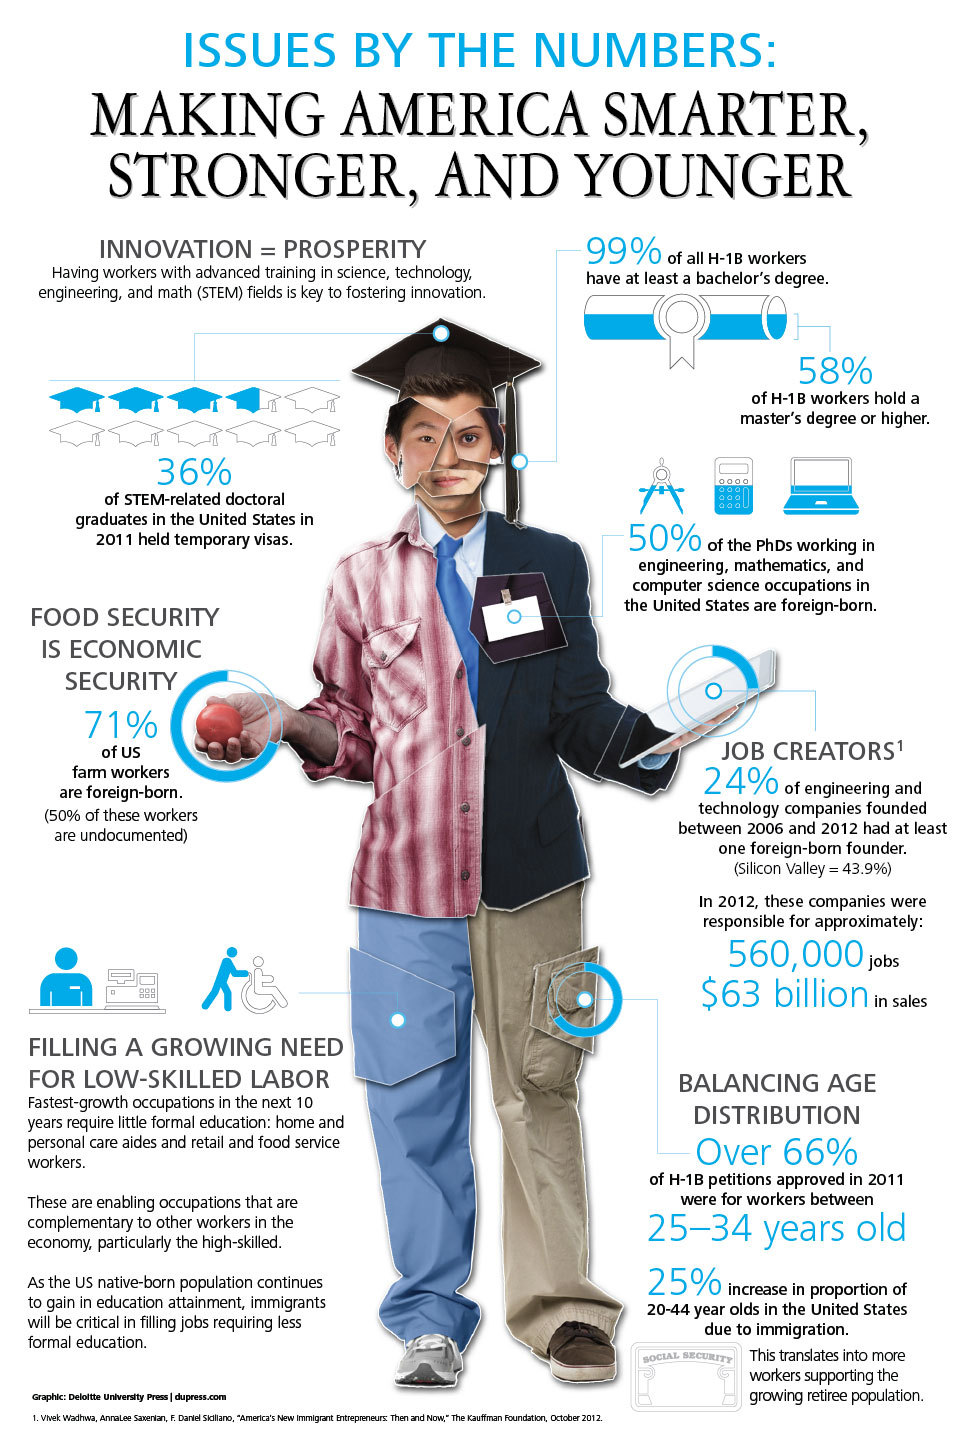
A few years old, but just as relevant today as it was a few years ago. The Making America Smarter, Stronger, and Younger infographic sums up the statistics behind the argument for Immigration that the Deloitte University Press makes. Deloitte believes a thoughtful look at immigration reform will help the U.S. secure and maintain its competitive edge in a world where the most highly skilled have a choice when it comes to where they live and work.
Immigration and immigration reform are perennial topics of debate in the United States. What do the data say about how immigration is shaping the country?
The United States cannot be complacent that the advantages conferred by past immigration will continue into the future as global competition for talent increases. It is clear that this more intense global competition will be fought on many fronts. A thoughtful look at immigration reform—one that balances family and workforce needs—may well hold one of the keys for the United States to gain and maintain a competitive advantage in a world where the most highly skilled have a choice as to where they will live and work.
This infographic serves as a summary and a shareable social media asset that coordinates with the longer article, How immigration is shaping the United States, Issues by the Numbers, May 2013. This is one of the best ways to use an infographic!
The layout is still a little busy with a lot of text, but the design can stand on its own without the supporting article. The URL to the original infographic landing page and the supporting article are missing in the infographic. These should be included so readers can find their way since more people won’t include those links when they share the infographic.
Partially filling shapes to represent percentage values is never a good idea for designers. Your eye sees the area of the filled shape, but designers are only calculating the height of the fill. It’s almost never an accurate visual representation of the data.
Thanks to Courtney for sending in the link!