Why Do Businesses Fail?
Starting your own business can be rewarding, but there are a lot of challenges. Why Do Businesses Fail? infographic from Insurance Quotes and NowSourcing outlines some of the biggest problems, paired with solutions.
Small businesses often have a hard time making it work. Just how hard of a time may surprise you. Did you know that 20 percent of businesses fail in the first year, while 70 percent fail by year 10? The biggest contributing factor may seem obvious — cash flow problems.
Despite all these challenges to starting and maintaining your own business, the payoff can make it worthwhile. Here at insuranceQuotes we want to help you navigate the challenges of starting a small business and understand the pitfalls that lay ahead. Here are some facts and strategies that can put you on the path to success.
Information is key for small businesses to survive and thrive. Keep in mind that having the proper business insurance can help you keep a mishap from becoming a disaster, whether you are just starting out in a new business or have been around for years.
Let us know your thoughts on the information we provided and please share any personal business stories that may help other entrepreneurs on our Facebook page. Your successes or failures could help others.
Big Fonts are not Data Visualziations!
There's a lot of great data included in this infographic, but there's too much text in this design and a number of the statistics could have been visualized better. Way too many statistics are shown as just large text numbers without any visualization or context.
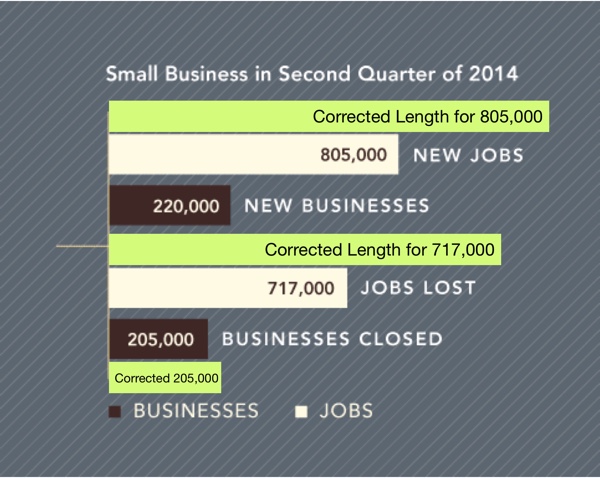
There are a number of things wrong with this particular chart. The bar lengths don't match the data values. The bars for 220,000 and 205,000 should be very close, and they're not. Here I've added corrected bars to each cluster using the existing bar length for the New Businesses bar as the base.

Maybe this is a non-zero baseline chart? If so, this is intentionally misleading to readers by showing the scale.
Found on Entrepreneur


