The Data Visualization Toolkit signed book giveaway
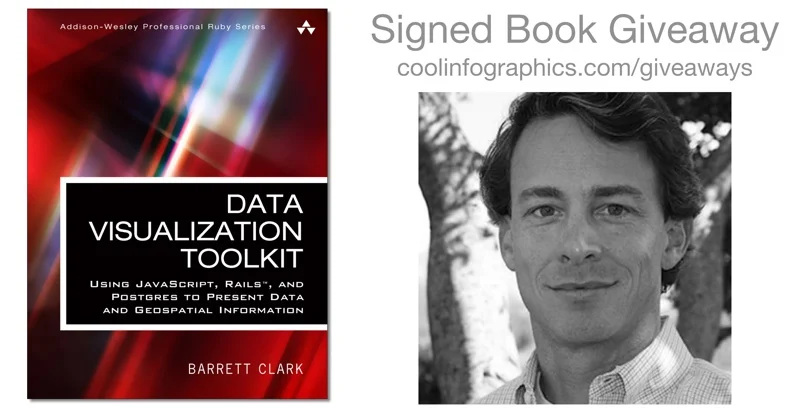
For the April Giveaway, I have a signed copy of the Data Visualization Toolkit by Barrett Clark. Register on the Giveaways Page by April 30th to be entered.
From Amazon:
Data Visualization Toolkit is your hands-on, practical, and holistic guide to the art of visualizing data. You’ll learn how to use Rails, jQuery, D3, Leaflet, PostgreSQL, and PostGIS together, creating beautiful visualizations and maps that give your data a voice and to make it “dance.”
Barrett Clark teaches through real-world problems and examples developed specifically to illuminate every technique you need to generate stunningly effective visualizations. You’ll move from the absolute basics toward deep dives, mastering diverse visualizations and discovering when to use each. Along the way, you’ll build three start-to-finish visualization applications, using actual real estate, weather, and travel datasets.
Clark addresses every component of data visualization: your data, database, application server, visualization libraries, and more. He explains data transformations; presents expert techniques in JavaScript, Ruby, and SQL; and illuminates key concepts associated with both descriptive statistics and geospatial data. Throughout, everything is aimed at one goal: to help you cut through the clutter and let your data tell all it can.
Barrett recently gave a talk called "Making Data Dance" at the DFW DataViz Meetup event, and I had a chance to ask him a few quesitons:
What does it mean to make your data "Dance”?
Barrett Clark: I think data wants to tell a story. Our job is to figure out what that story is and how to best present it. Seeing the data in a visual way can make it come to life and dance.
Who is the book written for?
Barrett Clark: Data Visualization Toolkit focuses on looking at data from the perspective of a web developer. More specifically, I speak from the perspective of a developer writing Ruby on Rails apps. There is a fair amount of JavaScript and SQL throughout the book, and I try to explain what I am doing throughout the text. My goal was to make a book that is accessible to anyone while still giving more experienced developers something valuable.
Can readers get all of the data and code you reference in the book?
Barrett Clark: Absolutely! There are 3 different applications that readers will build throughout the book. The code and data for the applications are available on GitHub at http://DataVisualizationToolkit.com. I also have checkpoints throughout the text where you can see what the application should look like at that point. Those are enumerated in the README for each application.
Why do you prefer PostgreSQL as your database platform of choice?
Barrett Clark: I have worked with several databases. PostgreSQL, or Postgres as it is often called, is by far my favorite. It is a robust database that is easy to use, has a wide array of functions and data types, and is also extendable. You can easily add to the functionality of a Postgres database with an extension. In fact, the core database ships with dozens of extensions that you don't need to install. PostGIS, which allows you to store geospatial data and perform geospatial queries, is one of my favorite extensions.
Why is the database and transforming your data before your create the visualizations so important?
Barrett Clark: I have seen very few data sets where you can take data directly from the database into a chart -- especially with transactional data. You can perform the data transformations in the database using SQL, in the application server using the application's prorgamming language, or in the browser using JavaScript. Databases are really good at dealing with data, so I encourage people to not be afraid to write SQL to pull out the data in the format that you need it.
What are the challenges for visualizing data on websites?
Barrett Clark: Speed. When you have a lot of data you need to be thoughtful about how quickly you can get the data and display it in a meaningful way. This may require some additional setup to store data for reporting in a separate format so that you don't have to do the transformations in real time. Another challenge is that you have no control over the end user's viewing experience. Something that you think looks brilliant on your laptop may look awful on someone else's screen.
What’s different about visualizing geospatial data?
Barrett Clark: Geospatial data is a lot of fun! When you add location to the mix you open up a whole new arena of things that you can do visually with your data, and questions that you can ask of the data. I love maps. I take readers through the creation of one of my favorite types of map -- the choropleth. That's where you color areas (counties, states, etc) in a map based on the data.
Are your visualizations mostly static or interactive data visualizations?
Barrett Clark: There are some mouseover effects in my visualizations that help add more context to the graph or highlight something.
What are your thoughts on D3.js and its future?
Barrett Clark: I love D3, and I also love what Mike Bostock has done to build such a deep assortment of examples. Between the examples and the documentation I find D3 really fun to work with. The library is also very actively maintained. As soon as I shipped Data Visualization Toolkit a new version of D3 dropped. There are branches in all 3 sample project repositories on GitHub with the updates required for D3v4.
Are you speaking at any upcoming presentations or webinars?
Barrett Clark: In the past few months I've spoken at PGConf Silicon Valley in San Francisco and RubyConf Australia in Melbourne. I'll be taking a break from travel for a bit and focusing on local meetups. I try to get out to the Dallas Ruby meetups whenever possible.
What’s the best place to follow you online?
Barrett Clark: I'm @barrettclark on Twitter.


