DataViz Books Read by Evelina Judeikyte

A map of dataviz books that designer Evelina Judeikyte read in 2022.
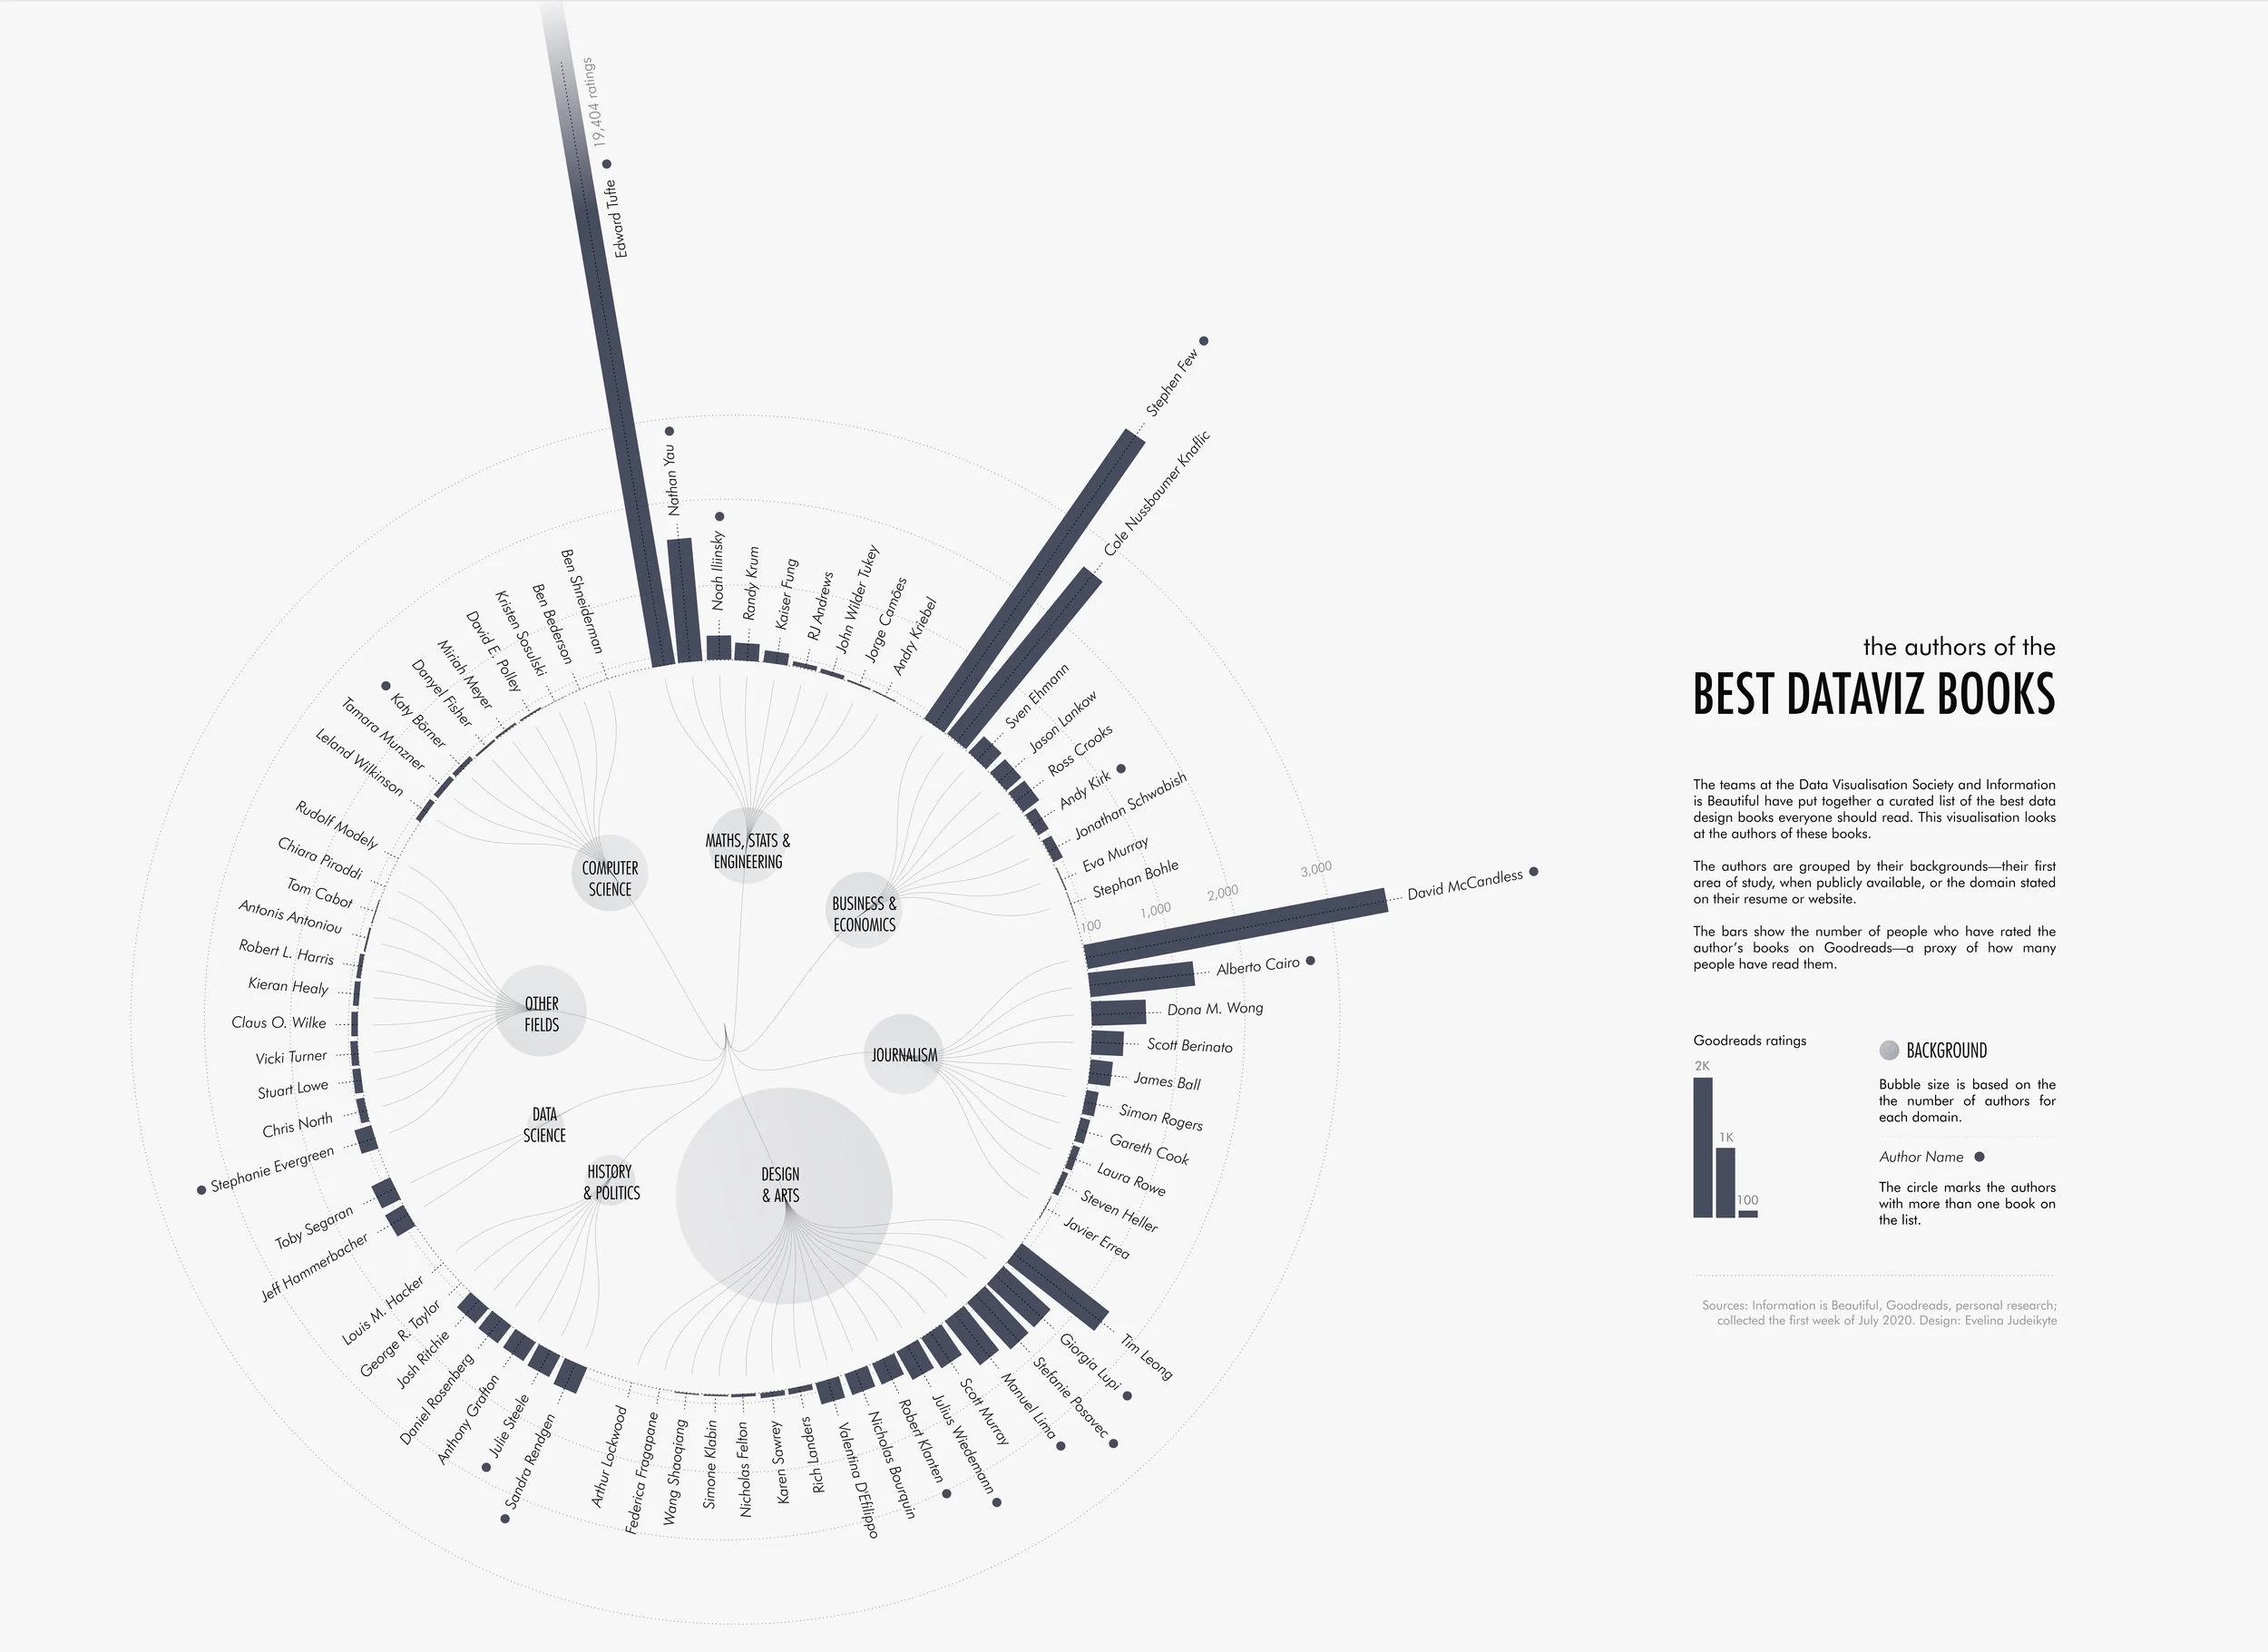
I get this question so often that in 2021 I created a visual map of the dataviz books on my shelves. If you’ve been following me for a while, you may remember the scatter plot below that sparked quite a lot of discussions on social media. As 2022 is coming to a close, I updated this map with the books I read in the past 12 months — you can recognize the new ones by the hatched pattern.
This is a fun visualization based on purely subjective data. It highlights some of the great DataViz books out there, and plots them into a scatterplot
My library has over 100 DataViz books, and I could see this design growing in future versions. A few things I think could improve the design:
Size the bubbles based on an additional data set like number of pages, price or Amazon ratings.
Move the axes to the center to create quadrants
Edit the title or add the year the books were published. There was some confusion online these were books published in 2022, instead of books she read in 2022
Add both a source link to her original post, and a copyright or Creative Commons statement. Infographic images often get shared without links to the original, so including the URL in the design helps readers find the original.
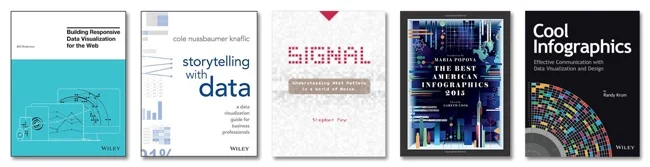
Hopefully she’ll read Cool Infographics in 2023!
Found on The Plot