Planets Mean Temperatures

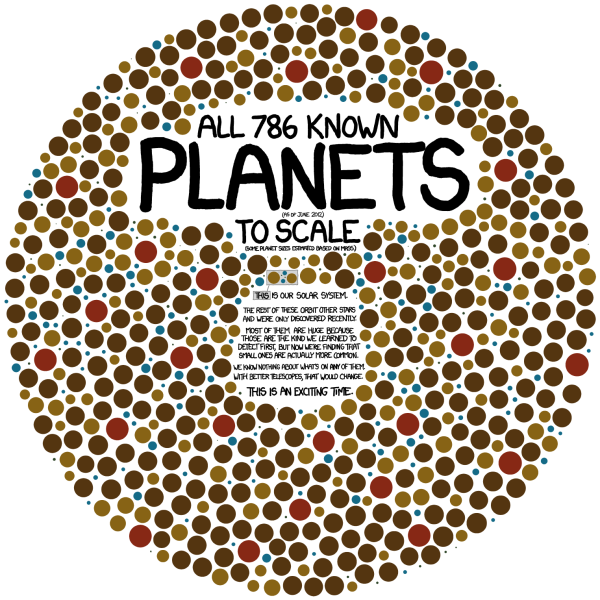
Planets Mean Temperatures made by Jonathan Chris uses a box and whisker plot to show the average surface or atmosphere temperature of a planet in Celsius or Fahrenheit. A cool way to use the normal layout of the solar system graphic, but with the twist that they are rearranged by mean temperatures instead.
Explore the mean temperatures of planets. The mean temperature of planets refers to the average surface or atmospheric temperature of a planet over a specific period of time. This measure provides a general indication of the thermal environment of the planet and is typically calculated by averaging temperature readings taken at various locations and times on the planet’s surface or atmosphere.
I love this simple visualization, and the use of the actual planet images on the chart instead of dots and text.
Found on Tableau Public Viz of the Day