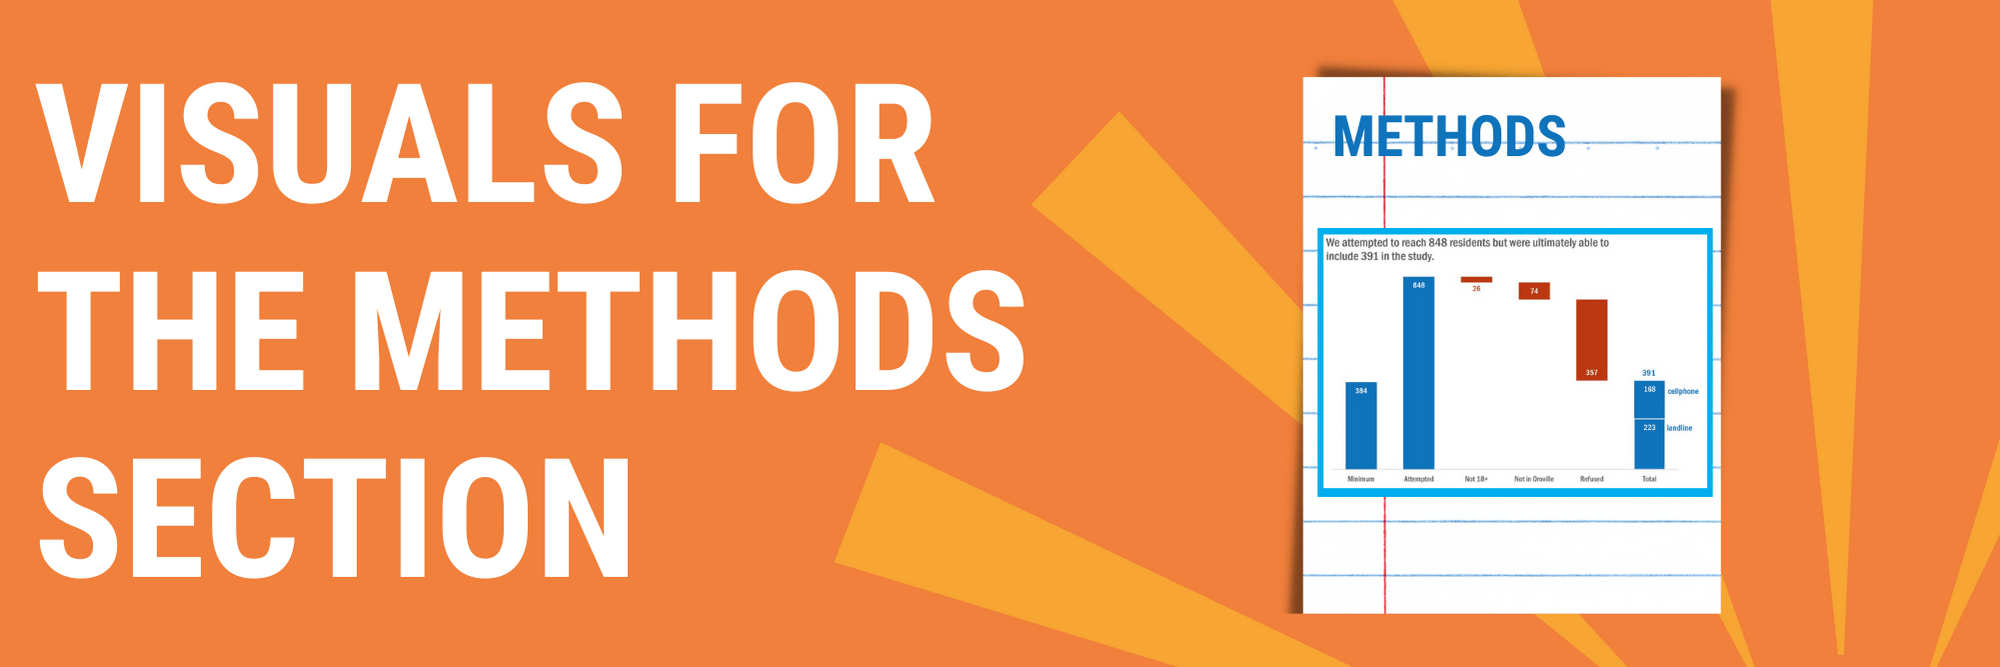
Visuals for the Methods Section
Stephanie Evergreen, “You can tell when someone is getting their data viz eye well-honed because they start asking where ELSE can I include visuals that will better explain my work? That’s Sue. She had grown comfortable with high-impact, story-telling charts in the Results section of her reporting but was staring down a solid wall of text when it came to her Methods section. She pitched the question to me in an Academy Office Hours session: What can I do with the Methods section?”
Read Stephanie’s answer at Visuals for the Methods Section (stephanieevergreen.com)


