7 Data Visualization Tips and Tricks
In the world of big data, people are constantly having numbers thrown at them. And complex numbers at that. Big data simply means larger, more complicated data sets at a more frequent rate from revolving sources. It’s increasingly common in businesses. But if you’re not a left-side-of-the-brain kind of person, it can be overwhelming to try to make sense of the figures, metrics, and statistics. After all, we can’t all be logic-driven mathematicians.
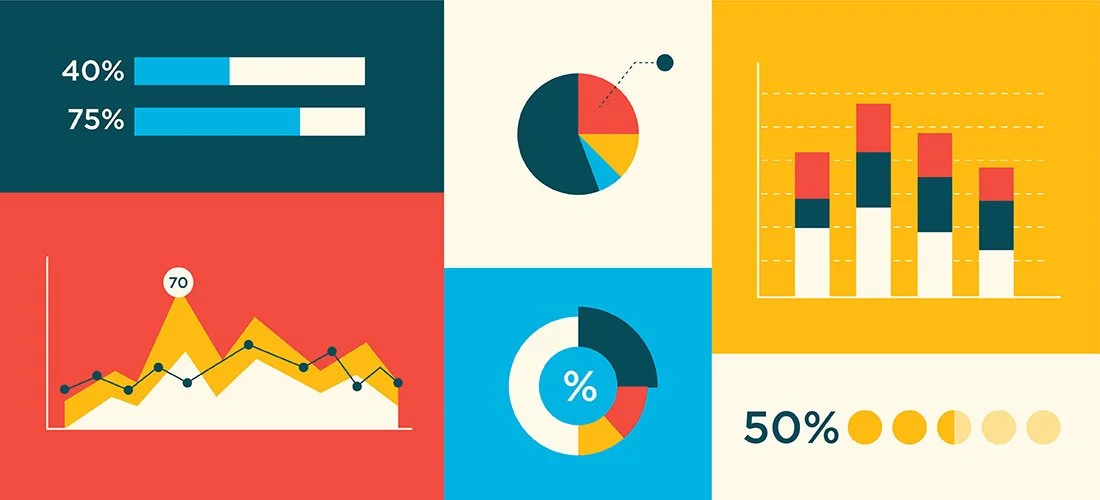
Thankfully there’s data visualization.