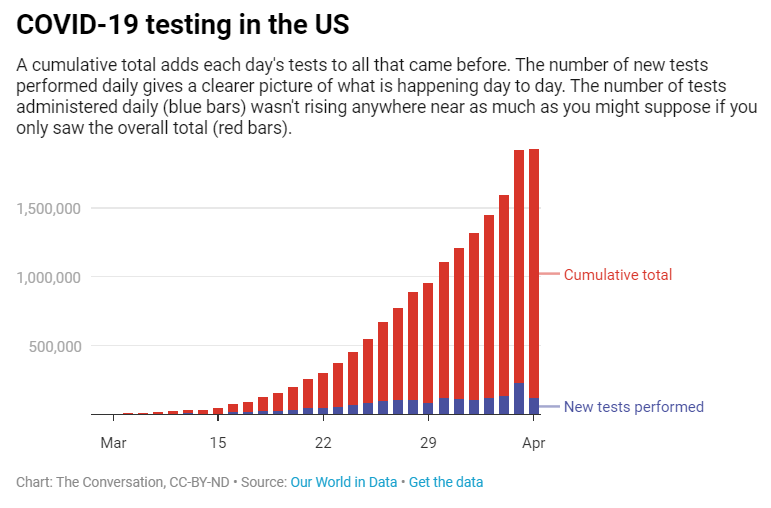
3 questions to ask yourself next time you see a graph, chart or map
Data visualizations, like charts and graphs, are embedded into our daily lives.
They have become especially prevalent throughout the coronavirus pandemic, helping the public understand complex data.
Though useful, they can also be misleading and at times purposely deceitful.
The next time you see a map or a graph, consider these 3 questions to confidently decipher the information.


