Choosing Fonts for Your Data Visualization
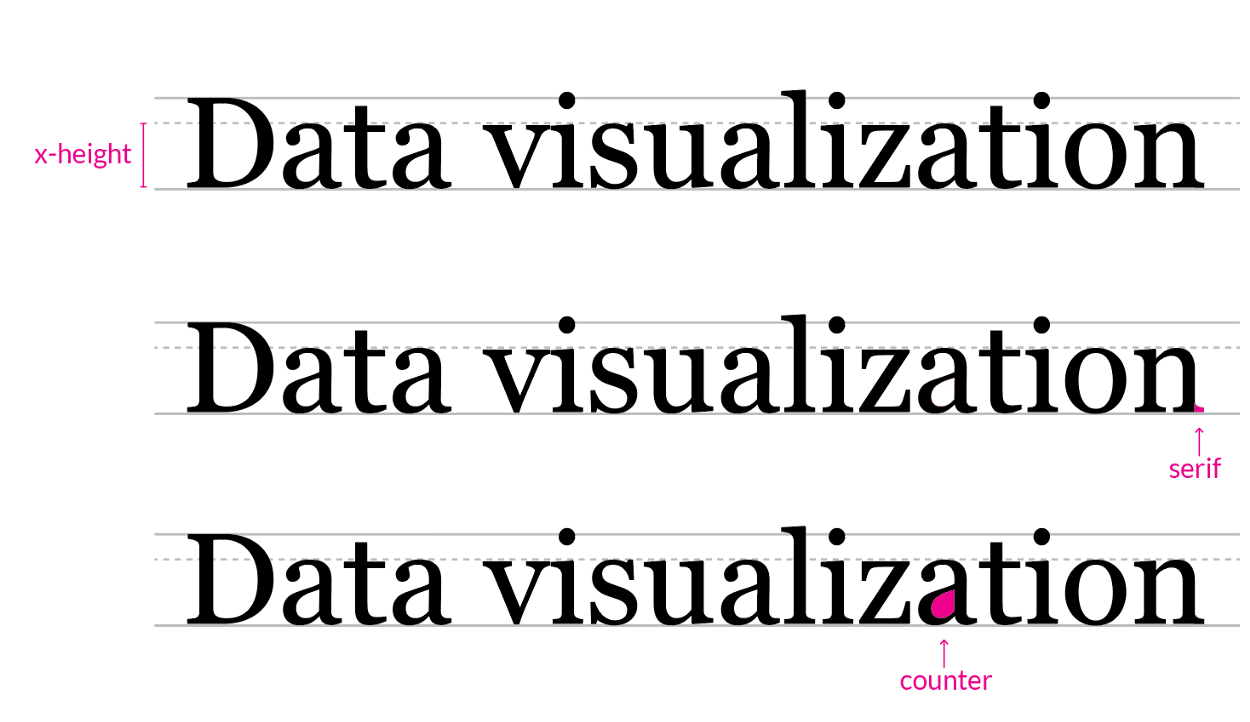
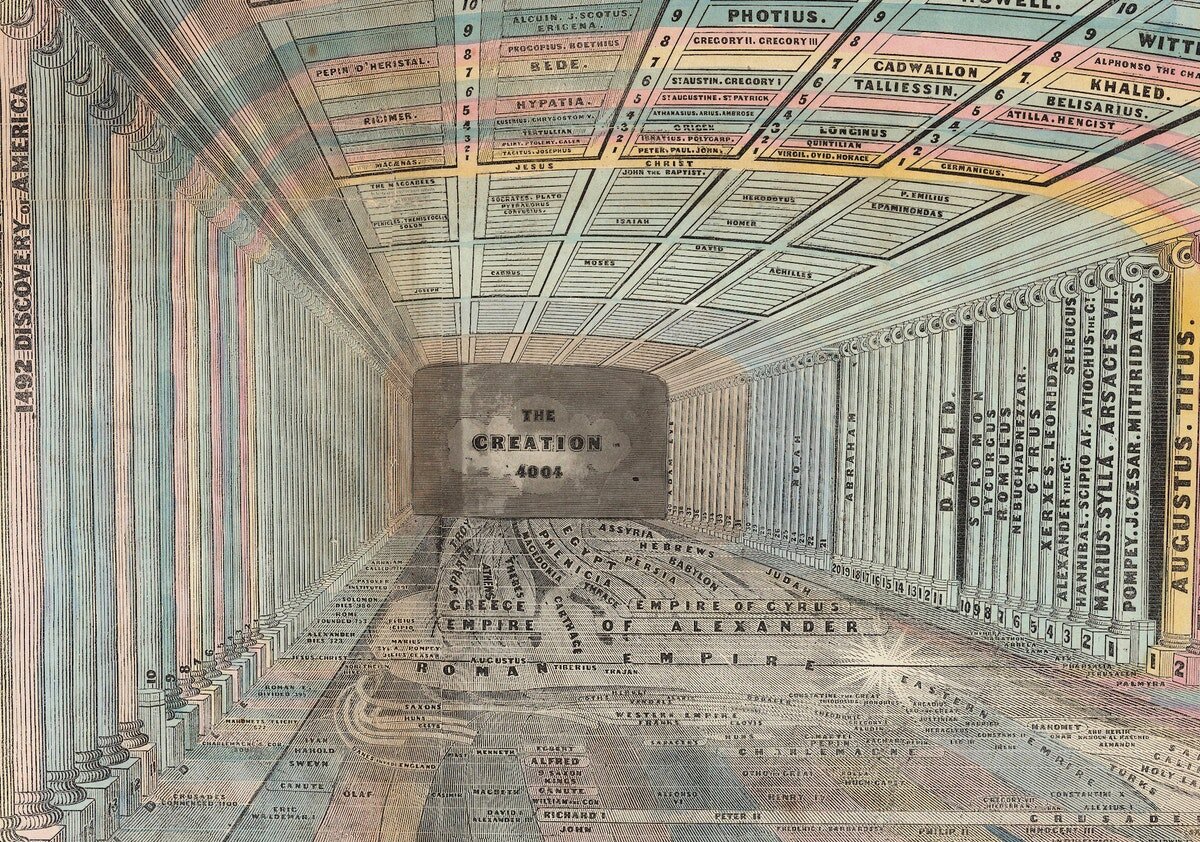
The purpose of data visualization is to provide a layout that relays lots of information quickly. Good visualizations help the user understand complicated data without allowing the design to get in the way. Any text accompanying the graphics should be easy to read to the point that it almost disappears.
Click here to read more. Found on Medium.com


