Randy KrumDesigner | Author | Instructor | Speaker

Randy Krum

Designer | Author | Instructor | Speaker


Cool-Infographics-Book-Cover-White.jpg

FREE Sample Chapter

Create data visualizations directly in a browser with data connectors in Tableau Public

Create data visualizations directly in a browser with data connectors in Tableau Public

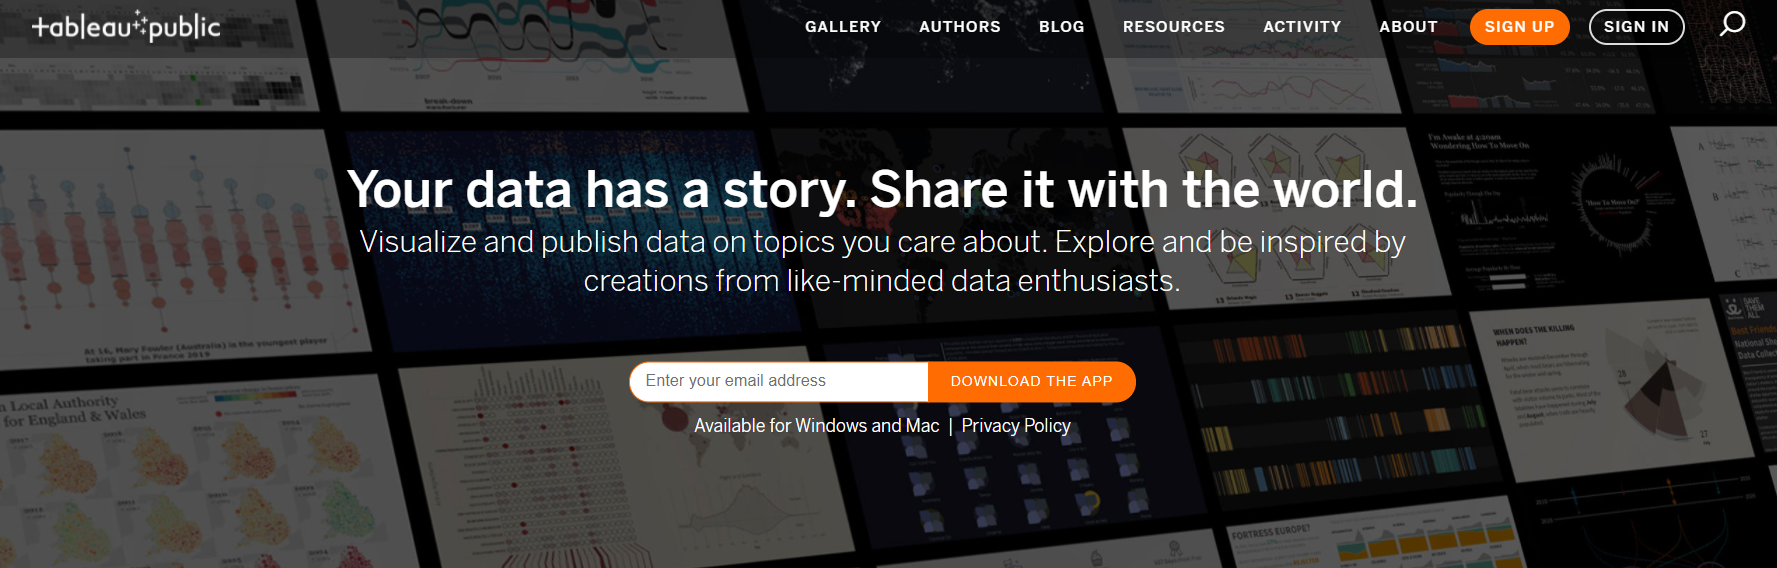
When you want to explore and create data visualizations, Tableau is happy to share that you can now connect to data on Google Drive or use the OData connector to start your viz creation process using web authoring on Tableau Public. Try the new feature by signing in and navigating to your profile page and clicking ‘Create a viz’. If you don’t have a Tableau Public profile, create one for free.

Create data visualizations directly in a browser with data connectors in Tableau Public | Tableau Public

These 1,000 hexagons show how global wealth is distributed

These 1,000 hexagons show how global wealth is distributed

What's New in Visualizing Survey Data Using Tableau (July 8, 2021)

What's New in Visualizing Survey Data Using Tableau (July 8, 2021)