Data Visualization Using Seaborn Library In Python
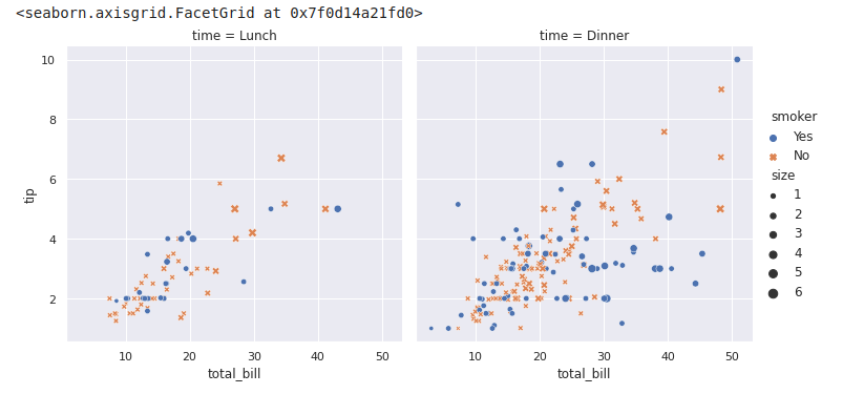
Data Visualization is an important tool to gain better understanding and to get more knowledge about the data. It helps data scientists to communicate with non data science people by telling a unique story using data. It is a representation of data using charts, graphs or maps to comprehend and visualize trends and patterns in data.


