Visualising knowledge: Lessons from 25 years of policy-related data visualisation
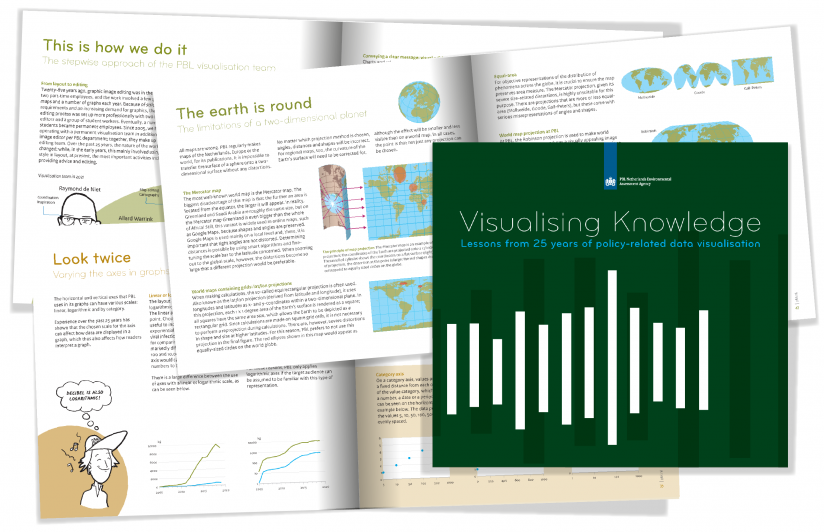
Visualising Knowledge is the English translation of the Dutch publication: ‘Kennis verbeeld’. It marks 25 years of experience in data visualisation at PBL Netherlands Environmental Assessment Agency and its predecessors, the Netherlands Environmental Assessment Agency (MNP), Netherlands Institute for Spatial Research (RPB) and the environmental section of the National Institute for Public Health and the Environment (RIVM).
Read more: Visualising knowledge | PBL Planbureau voor de Leefomgeving