


2,000 Years of Continental Climate Changes
Climate change is a complicated, and sometimes controversial, global topic. I really like this data visualization of 2,000 Years of Continental Climate Changes that was included as part of the report published by the “2K Network” of the International Geosphere Biosphere Program (IGBP) Past Global Changes (PAGES) project.
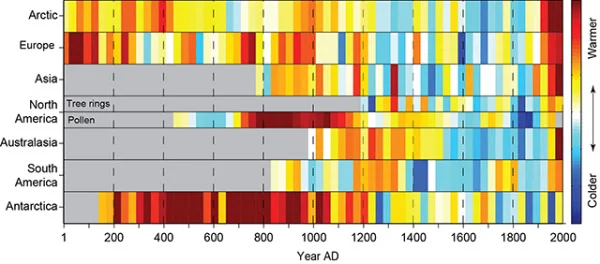
Thirty-year mean temperatures for the seven PAGES 2k continental-scale regions arranged vertically from north to south. Colors indicate the relative temperature. The most prominent feature of nearly all of the regional temperature reconstructions is the long-term cooling, which ended late in the19th century. North America includes a shorter tree-ring-based and a longer pollen-based reconstruction. Modified from: PAGES 2k Consortium, 2013, Continental-scale temperature variability during the past two millennia, Nature Geoscience, DOI:10.1038/NGEO1797.
Each color band represents a 30-year mean temperature found on each continent. Their choice of data visualization method is very compelling, and visualizes a huge amount of data in a small space.
I also love that a good data visualization can attract attention and build awareness all by itself.
Found on the post by Andrew Revkin on the NY Times Dot Earth blog.