GISTEMP Climate Spiral
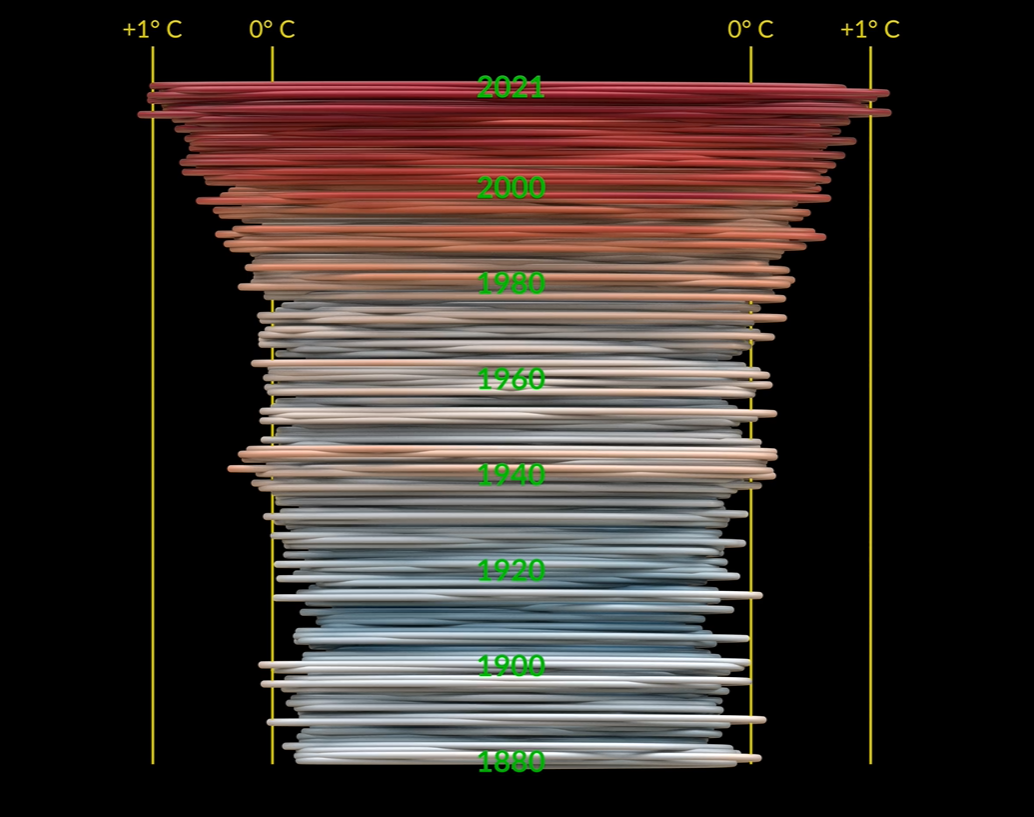
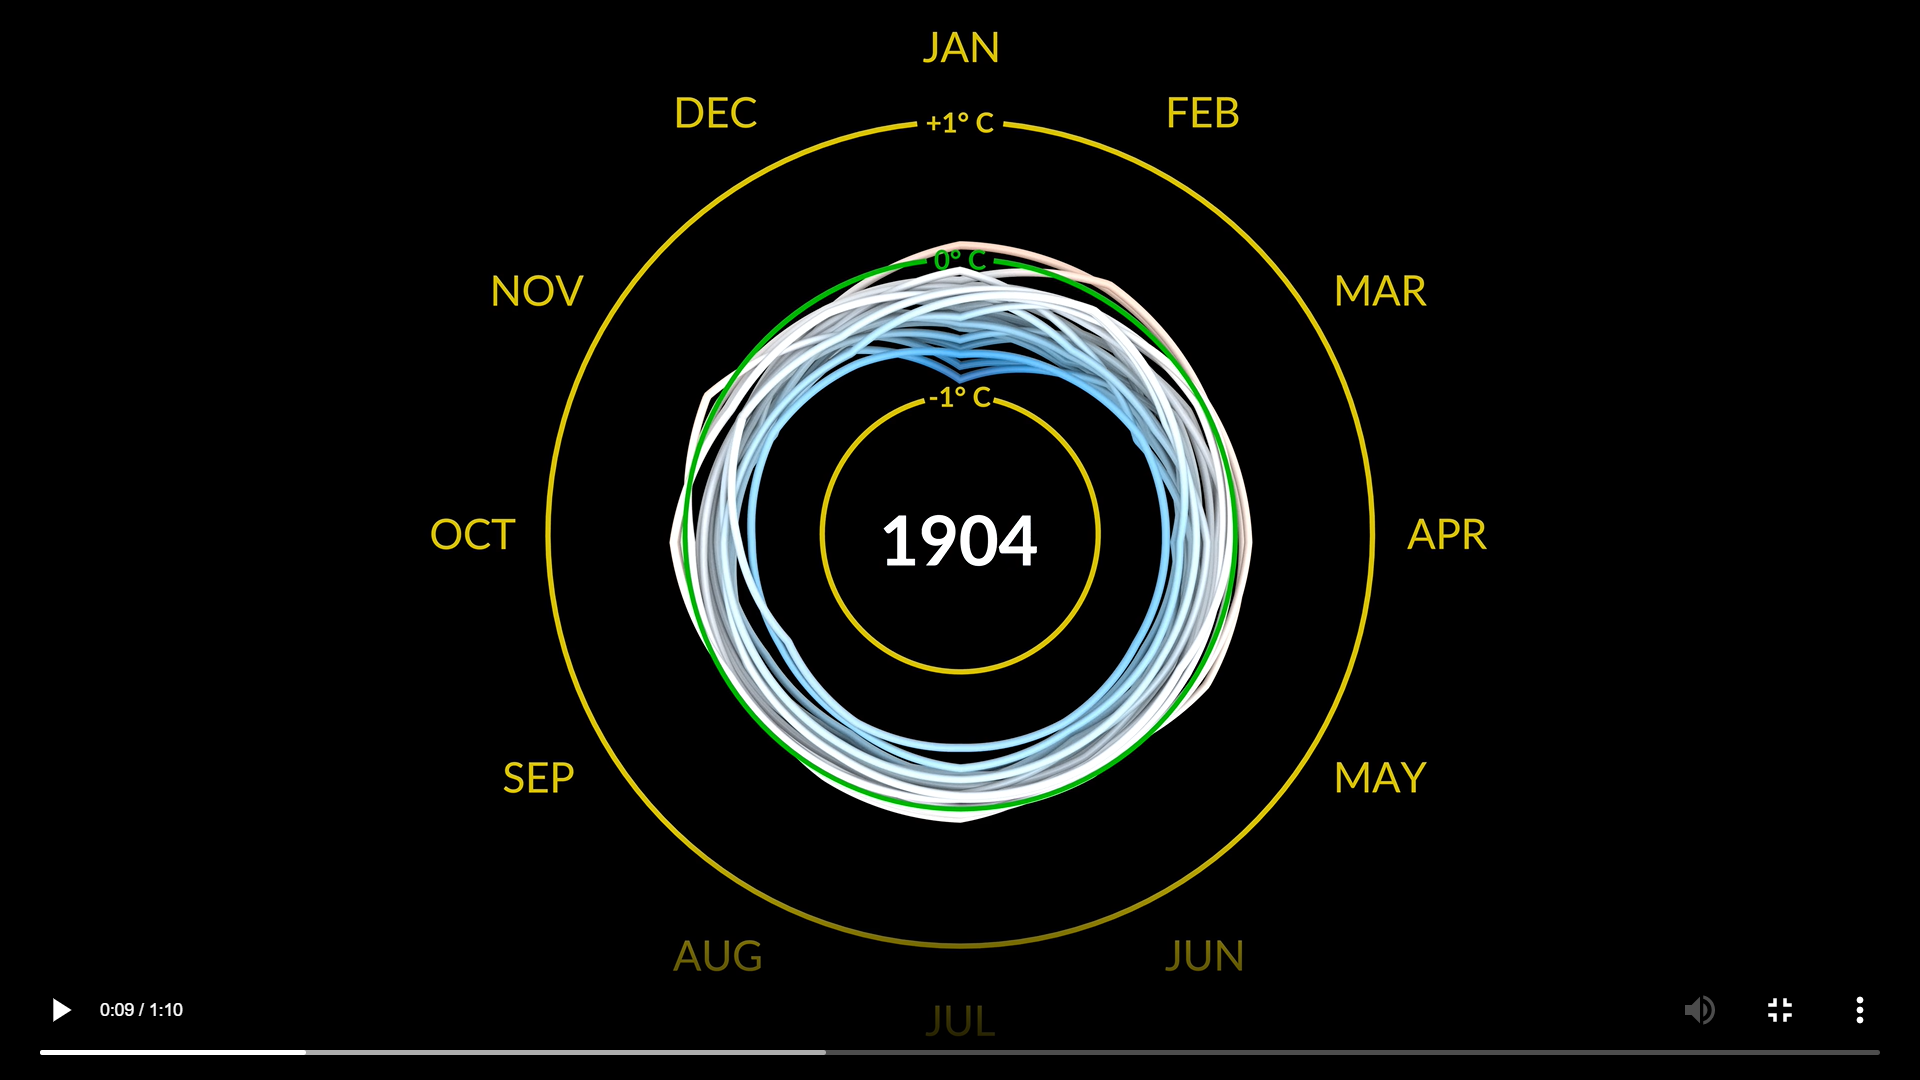
The GISTEMP Climate Spiral is an animated graphic created by NASA Visualization Studio showing the global surface temperature from the industrial revolution until today. TL;DR it’s getting hotter!
The visualization presents monthly global temperature anomalies between the years 1880-2021. These temperatures are based on the GISS Surface Temperature Analysis (GISTEMP v4), an estimate of global surface temperature change. Anomalies are defined relative to a base period of 1951-1980. The data file used to create this visualization can be accessed here.
The Goddard Institute of Space Studies (GISS) is a NASA laboratory managed by the Earth Sciences Division of the agency’s Goddard Space Flight Center in Greenbelt, Maryland. The laboratory is affiliated with Columbia University’s Earth Institute and School of Engineering and Applied Science in New York.
The 'climate spiral' is a visualization designed by climate scientist Ed Hawkins from the National Centre for Atmospheric Science, University of Reading. Climate spiral visualizations have been widely distributed, a version was even part of the opening ceremony of the Rio de Janeiro Olympics.
Check out NASA Visualization Studio for the full video.