Landslide for the "Did Not Vote" Candidate in the 2016 Election!
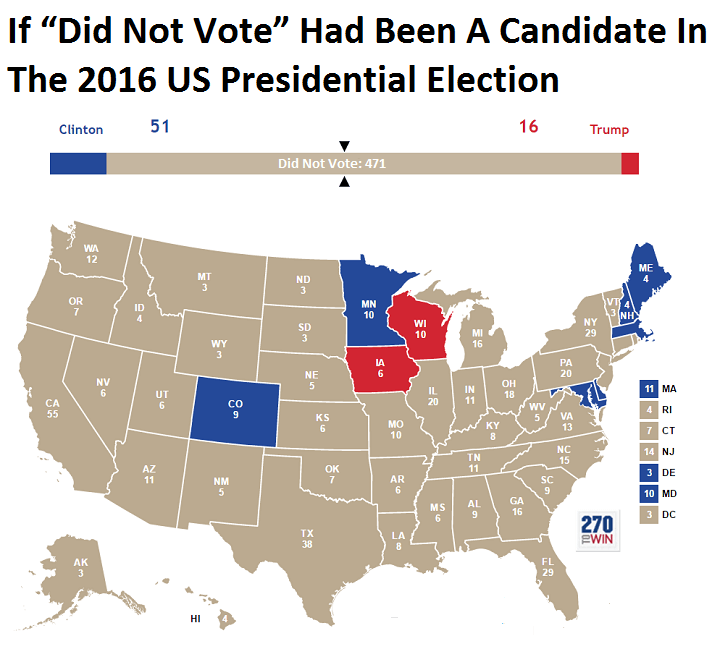
From BrilliantMaps, this is the Did Not Vote Election Map, showing the magnitude if all voting-eligible adults that did not actively vote in the 2016 Presidential election. A Presidential candidate needs 270 Electoral College votes to win. The "Did Not Vote" candidate would have have gathered 41% of the total votes from the voting eligible population, and 471 votes from the Electoral College! A Landslide!
The map above shows what the 2016 US Presidential Election results would have been if votes not cast for Hillary, Trump or one of the third party candidates had gone to fictional candidate “Did Not Vote.”
As a percentage of eligible voters, Clinton received 28.43% (65,845,063) of all votes compared to Trump’s 27.20% (62,980,160) and Did Not Vote’s 44.37%(102,731,399).
Total voter turnout was estimated to be 55.3% of the voting age population and 59.0% of the voting eligible population.
Map created using 270 To Win, based on reddit user Taillesskangaru’s posts here and updated here.
Disclaimer: The map above was accurate as of January 17th, 2017. Totals below were true at the time of writing but may no longer currently be accurate as additional votes and recounts are conducted.
Thanks to Mike Wirth for sharing on Facebook!