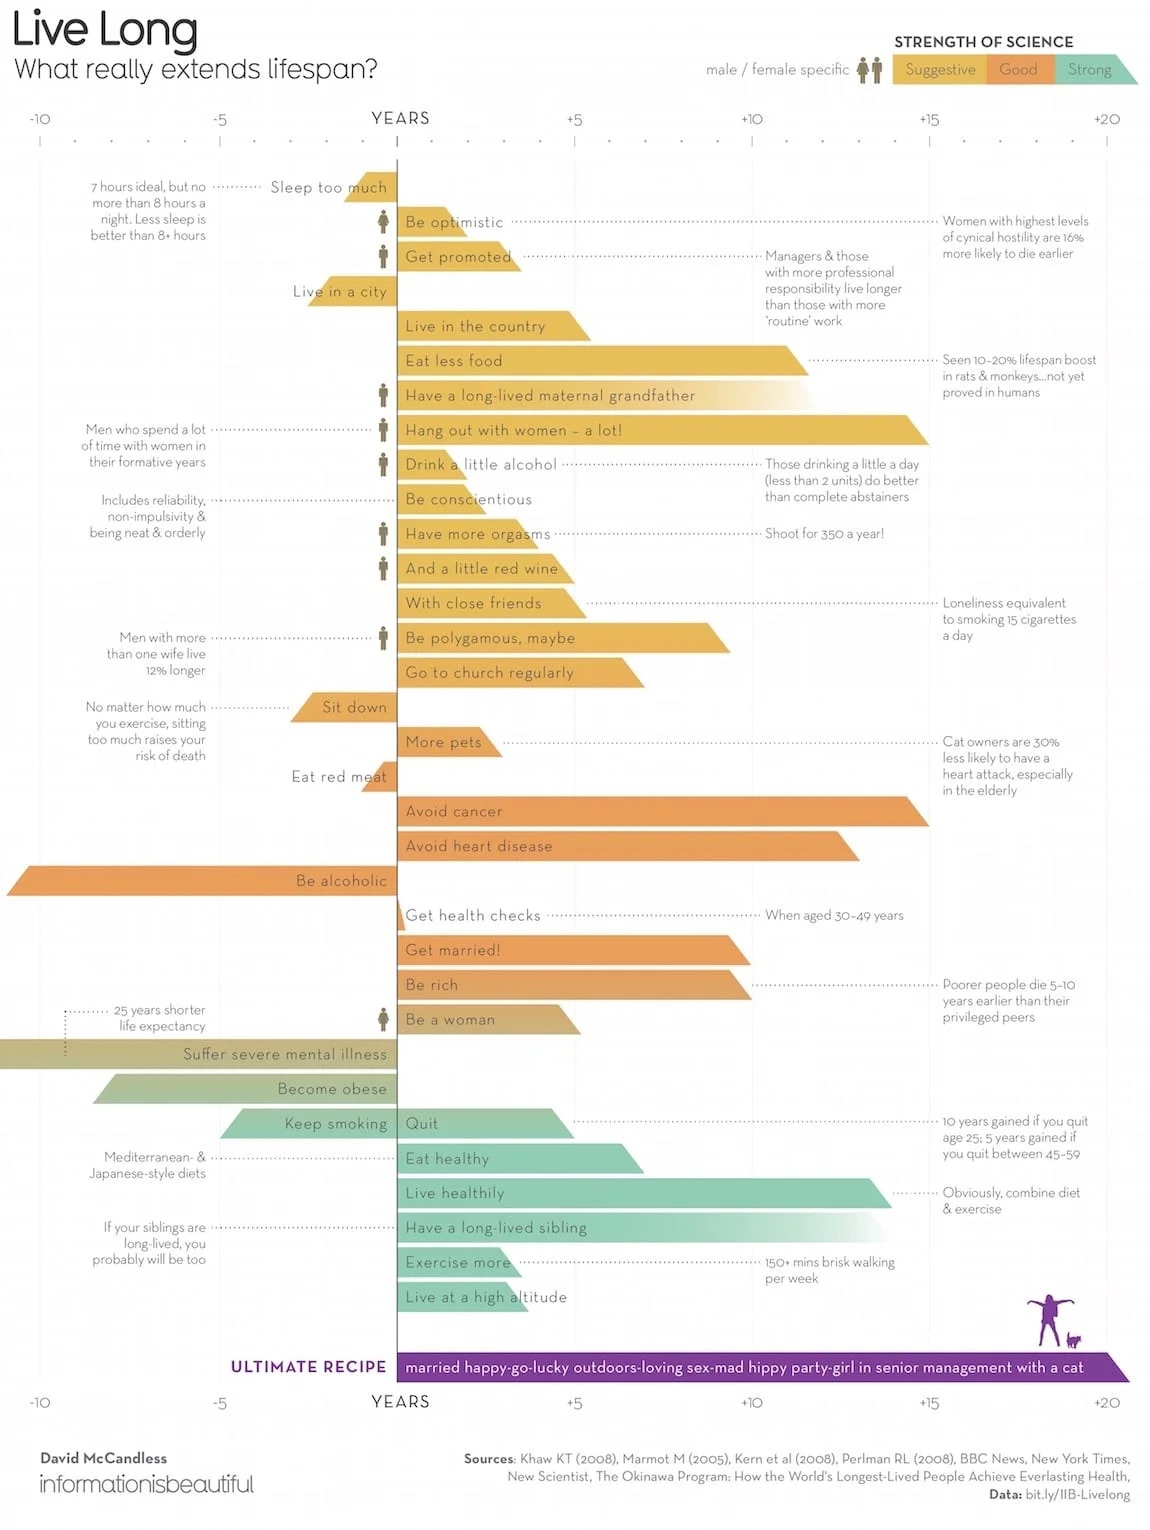
How the Tech Giants Make Their Billions

The infographic How the Tech Giants Make Their Billions from VisualCapitalist breaks down how the Big Five major tech companies make their money.
Together, the Big Five tech giants combined for just over $800 billion of revenue in 2018, which would be among the world’s 20 largest countries in terms of GDP. More precisely, they would just edge out Saudi Arabia ($684 billion GDP) in terms of size.
Meanwhile, they generated a total of $139 billion of net income for their shareholders, good for a 17.3% profit margin.
Let’s dig deeper, and see the differences in how these companies generate their revenue.
You are the Customer: In the broadest sense, three of the tech giants make money in the same way: you pay them money, and they give you a product or service.
You are the Product: Both Alphabet and Facebook also generate billions of dollars of revenue, but they make this money from advertising. Their platforms allow advertisers to target you at scale with incredible precision, which is why they dominate the online ad industry.
I have a few thoughts on their use of these doughnut charts:
They tried to use brand color to be relevant to each company, many of the sections are visually hard to differentiate because the colors are too similar.
The thin doughnut thickness allows for all of the data to be shown inside of the rings
I like the color-coded text to match each doughnut segment
Yellow text on a white background is never a good idea, even if it is one of the brand colors. Very hard to read!
There’s an argument to be made that the size of the doughnut charts should be proportional to the total revenue of each company. This infographic stays focused on only breaking down the total revenue of each company, but that visually shows Facebook with $56B in revenue at the same size as Apple with $266B in revenue.