Voting-Rights Restriction Bills Sankey Analysis
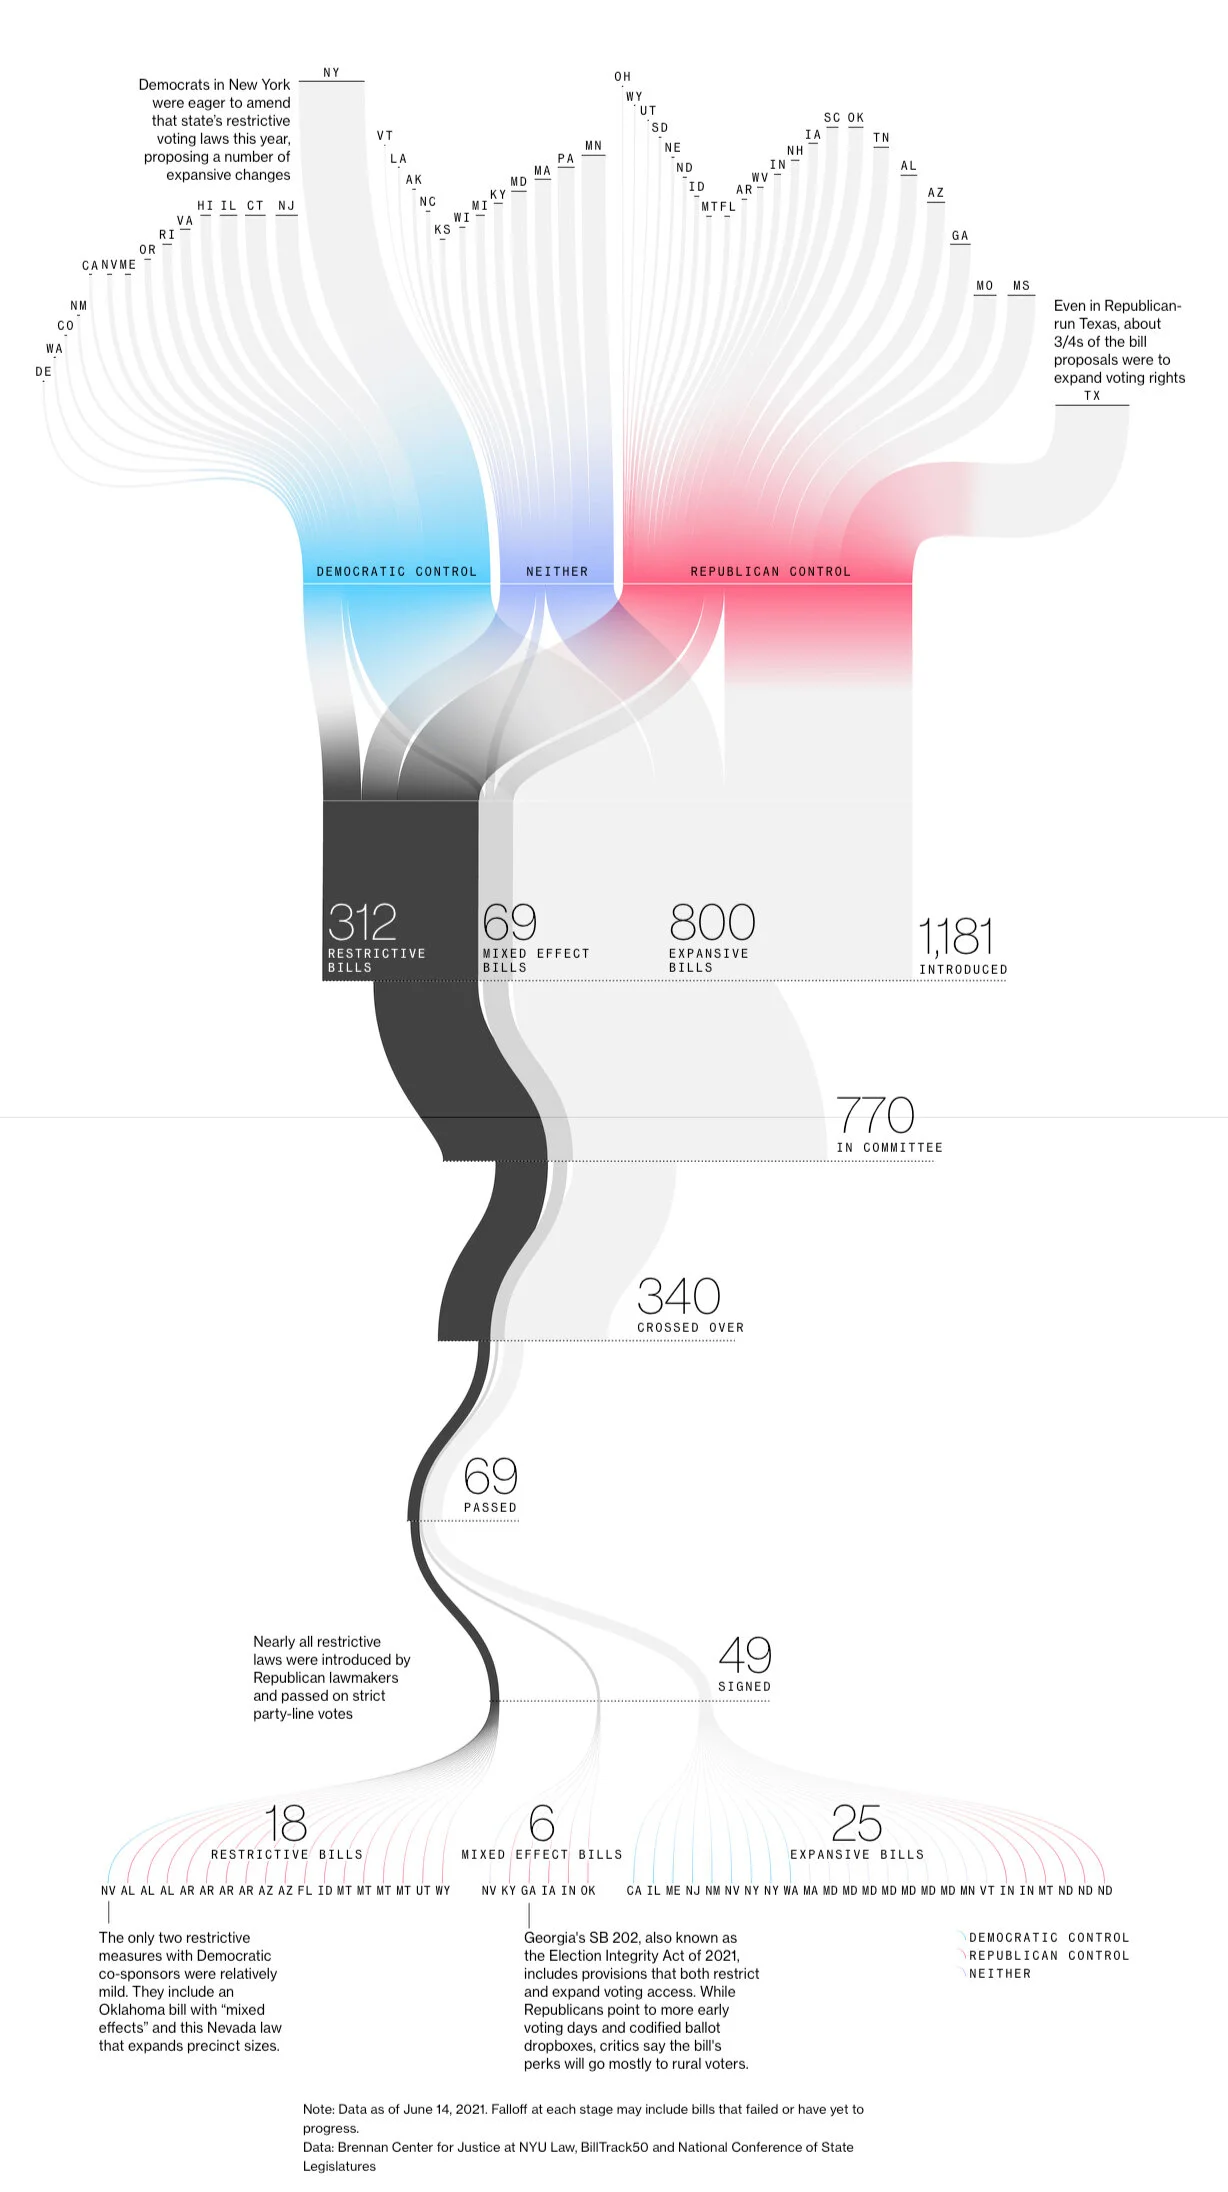
This was released in June, and I want to share it before we get into the next election season this Fall. Republicans Fall Short in Voting-Rights Crackdown While Adding Hassle at Polls is a data visualization showing how the threat of stricter voting rules was reduced down to a few bills that actually passed. Bloomberg shows that the number of expansive bills that were proposed actually outnumbers the amount of restrictive bills, and the bills that did pass still weigh in the favor of expansive. To get an even more in-depth look, the states and bills are color coded to show Democratic vs Republican control.
A nationwide move by Republicans to tighten voting rules in the wake of Donald Trump’s defeat has largely fizzled into a few additional hassles for voters in the next elections, far short of the sweeping changes described by both the GOP and Democratic critics.
In the name of election security, Republican lawmakers passed dozens of new voting restrictions this year, adding hurdles to mail-in voting, reducing local control over elections and targeting innovations used by large urban counties during the coronavirus pandemic, even as Democratic-led states focused on making voting easier.
Republicans say that the changes are needed to restore confidence in elections after President Donald Trump’s false claims that massive fraud cost him a second term. Democrats argue the laws are aimed at suppressing votes from Black and Latino citizens after record-setting turnout, going so far as to label the moves “a new Jim Crow.”
From a DataViz perspective, I think this is a great use of a Sankey Diagram. This is hierarchical data where each level breaks down the detail from the level above.
From a data perspective, I would say this is a very shallow report. The number of bills is interesting anecdotally, but doesn’t take into account the actual content of the bills. Some of these bills might be extremely restrictive/expansive, and some just a little bit. Were the uber-extreme bills passed? You can’t tell from this view of the data. This is very similar to sentiment analysis, and just gives the reader a very top level view of the data.
Visit Bloomberg.com to see more details. You should be able to view the article, even without a Bloomberg subscription. You may need to use a Private or Incognito window.