The Dirty Bed Cleaning Guide
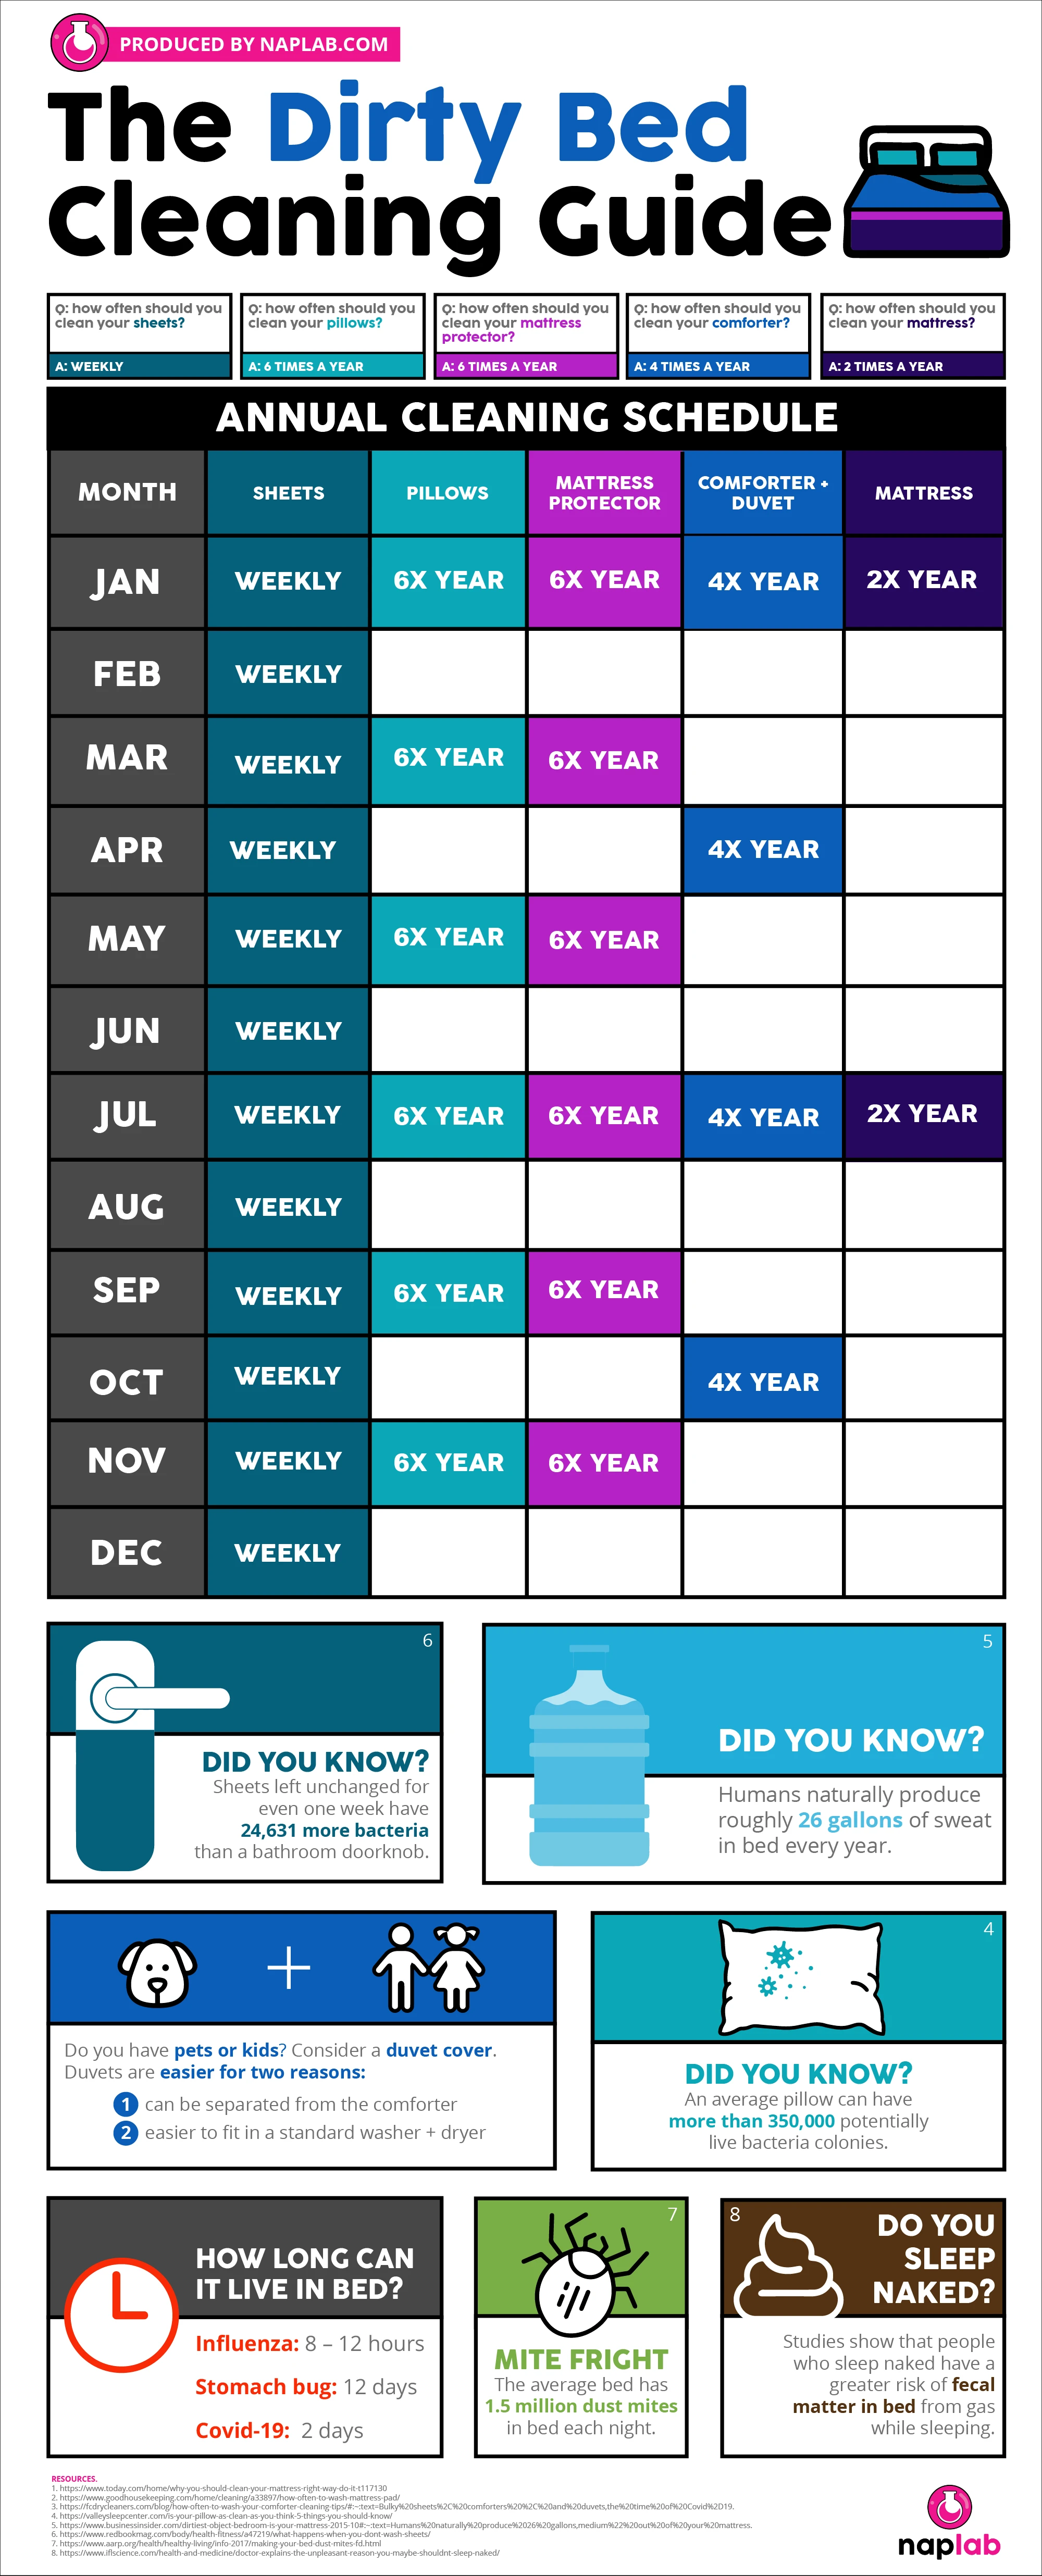
Keeping your home clean can be a full time job. The Dirty Bed Cleaning Guide by naplab can help you keep track of how often to clean your bed for optimal healthiness!
Your bed and mattress is more filthy than you realize. Within 2 weeks your clean sheets will have nearly 6,000,000 bacteria per square inch². By 3 weeks that number grows to 9.2 million². Learn how often to wash your entire bed setup.
This calendar visualization is a clean, simple, visual reminder that we all need to do more than just throw the sheets into the laundry. It’s effective to visualize the actual frequency of each event across months like this design does.
However, after that, the design gets lazy and all of the statistics below are hidden in text. A big missed opportunity here to create data visualizations for these stats which would make them relevant and meaningful to the audience. The impact of these stats is lost because the design doesn’t put them into visual context for the reader. Most readers of infographics don’t read all of the text from top-to-bottom. They’re only reading an infographic for 5-10 seconds total, and visualizations are must faster to understand.