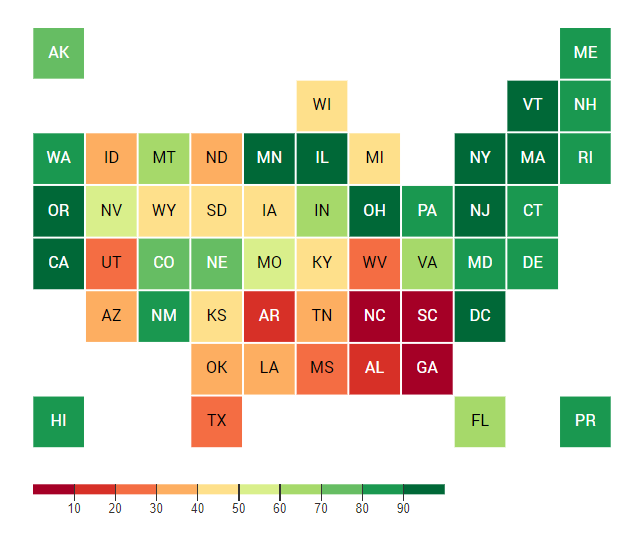
Best and Worst States to Work in America
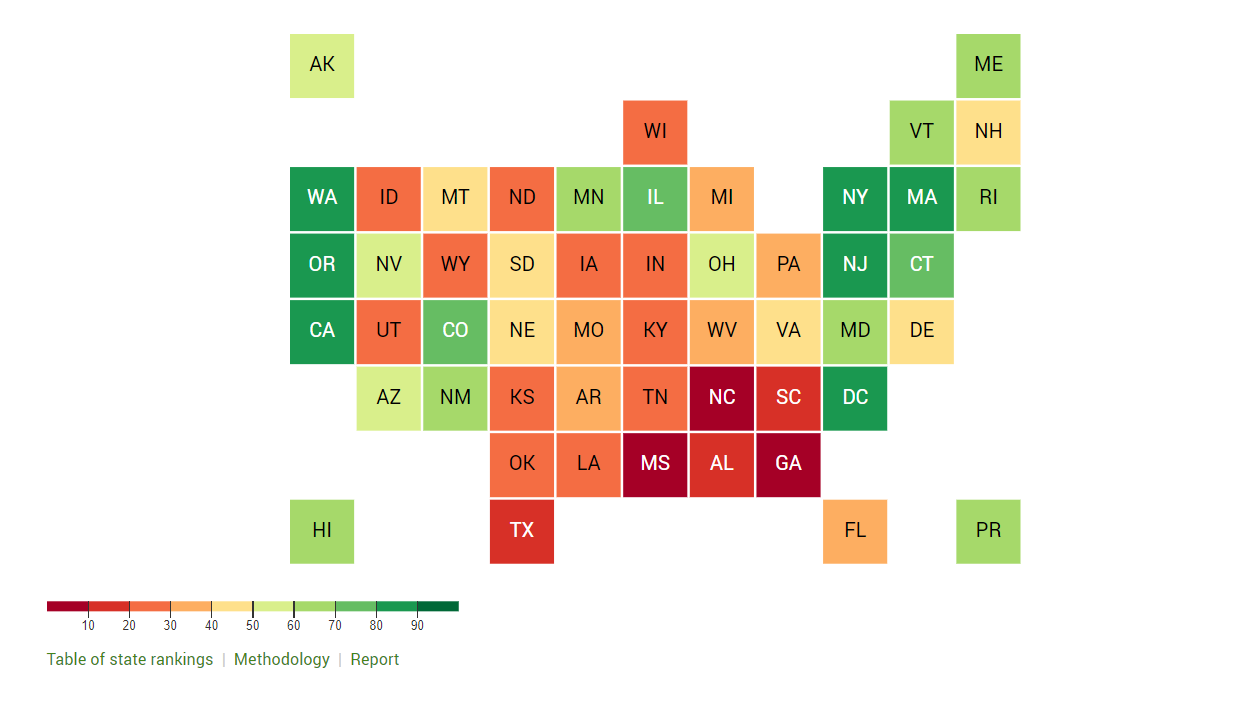
The Best and Worst States to Work in America infographic is the visualization of Oxfam America’s index. The index covers all 50 states, Puerto Rico, and the District of Columbia; grading these states based on the state’s policies as of July 2021 for wages (40% of score), worker protections (35% of score), and rights to organize (25% of score). How does your state rank?
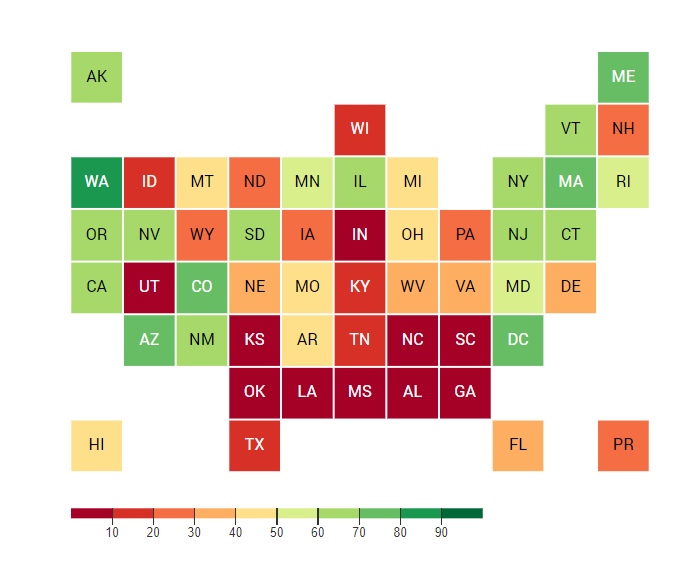
Wage Policies (40% of score)
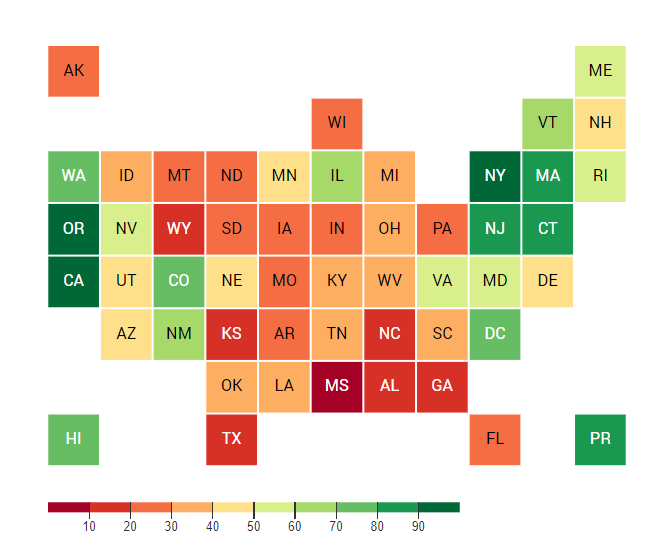
Worker Protections (35% of score)
Rights to Organize (25% of score)
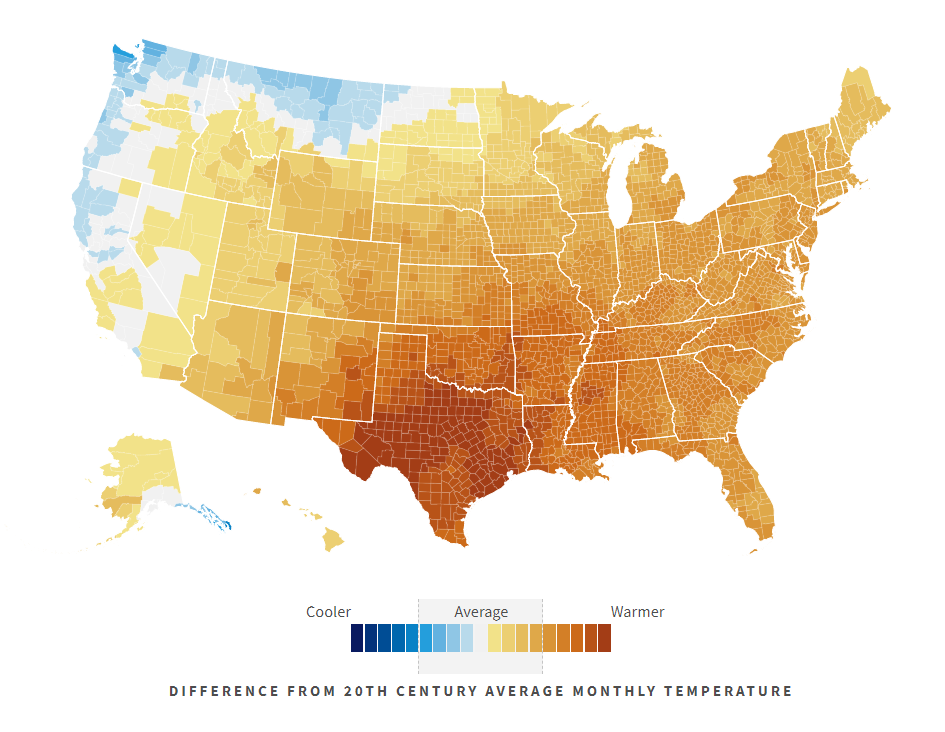
Workers in the US face dramatically different conditions based simply on where they live. Because the federal government has failed for decades to pass updates in labor laws, it has fallen to the states to determine wages, conditions, and rights.
The result is an ever-changing crazy patchwork of laws that have deepened inequality on geographic lines, and left millions of working families struggling to stay afloat.
As our economy inches toward recovery, it’s time to demand that the federal government step up and raise the bar for all workers in the US.
Thanks to Column Five for sharing this graphic!