Randy KrumDesigner | Author | Instructor | Speaker

Randy Krum

Designer | Author | Instructor | Speaker


Cool-Infographics-Book-Cover-White.jpg

FREE Sample Chapter

How to create beautiful, interactive Gantt charts

How to create beautiful, interactive Gantt charts

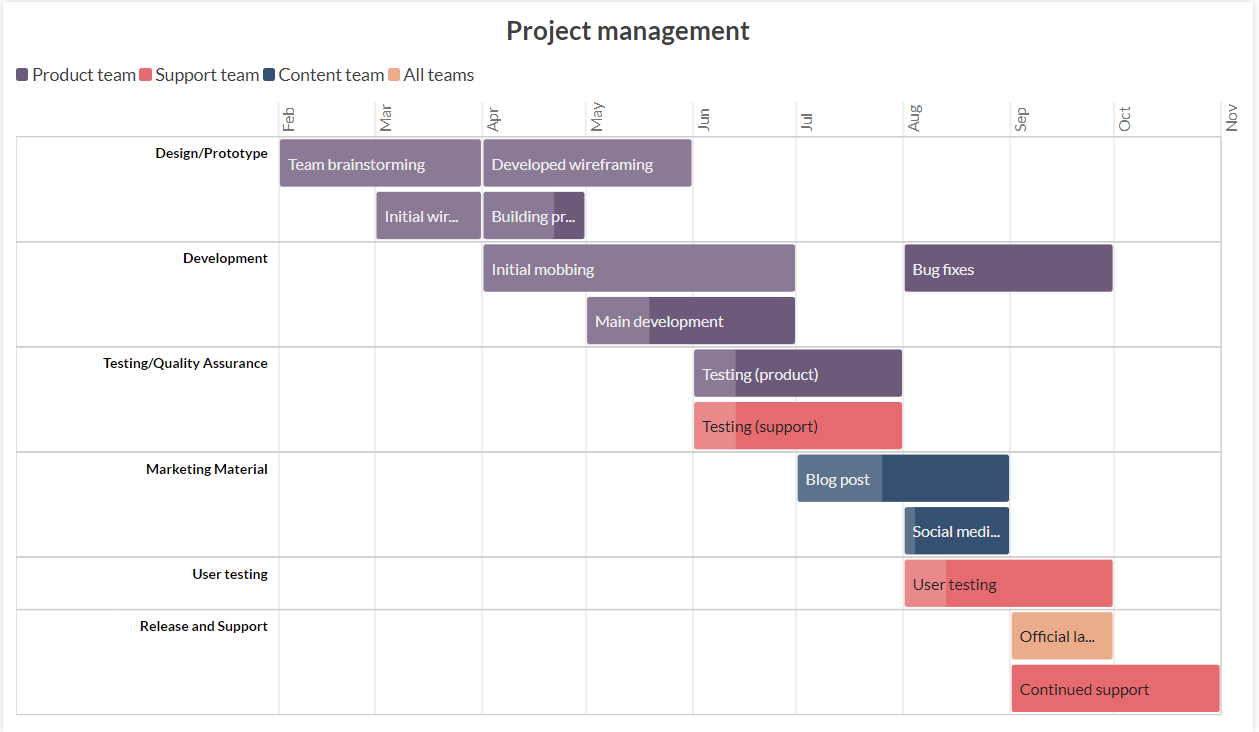
Unlike other Gantt tools, the new Flourish template lets you make a stunning visual that can be used not only as a flat image, but as an interactive graphic, complete with rich popup content. As with all Flourish charts, Gantts can be easily embedded online – and, on a business account, will pick up your company’s fonts, colors and styles.

How to create beautiful, interactive Gantt charts | The Flourish blog | Flourish | Data Visualization & Storytelling

Create data visualizations directly in a browser with data connectors in Tableau Public

Create data visualizations directly in a browser with data connectors in Tableau Public

COVID-19 Coronavirus Data Dashboard

COVID-19 Coronavirus Data Dashboard