Randy KrumDesigner | Author | Instructor | Speaker

Randy Krum

Designer | Author | Instructor | Speaker


Cool-Infographics-Book-Cover-White.jpg

FREE Sample Chapter

What is a Bullet Graph?

What is a Bullet Graph?

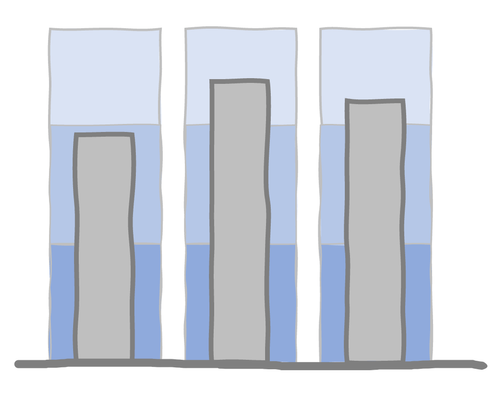
A bullet graph, or a bullet chart, is a variation of a bar chart, typically consisting of a primary bar layered on top of a secondary stack of less-prominent bars. Bullet graphs are best used for making comparisons, such as showing progress against a target or series of thresholds.

Read more: what is a bullet graph? — storytelling with data

Reasons to Visualise the Same Data, Differently

Reasons to Visualise the Same Data, Differently

So your Viz Flopped

So your Viz Flopped