Spoiler alert! Throughout the book, readers follow along as I plan, create, and prepare to deliver a critical presentation.


All tagged Storytellingwithdata
Spoiler alert! Throughout the book, readers follow along as I plan, create, and prepare to deliver a critical presentation.
Bullet graphs leverage our familiarity with bar graphs to deliver a lot of information in a compact space. If you want to display metric performance against a goal or reference point, a bullet graph offers a nicely consolidated design.
Dr Shneiderman developed the “treemap” in order to visualise this large amount of data—with multiple levels of folders and subfolders—in an efficient way, without taking up too much screen real estate.
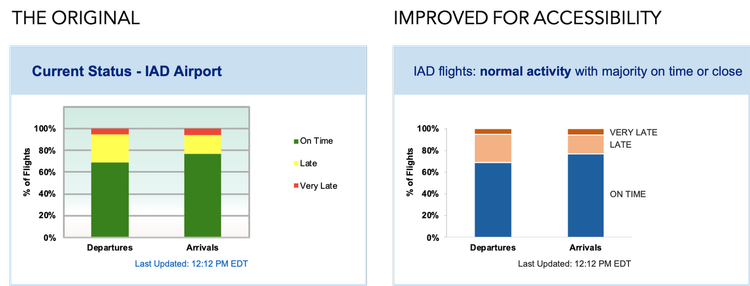
Creating accessible designs is important and should become a regular part of the design process.
One essential element of our charts and graphs rarely gets the attention it deserves: the legend.
This month, we encourage you to find some data related to vacation—about a trip you took, travels you hope to do in the future, or even general tourism data you are interested in visualizing.
While the topic of climate change is, to put it mildly, a real downer, there are other, more positive discussion areas of global relevance to cover—and other skilled communicators have created some outstanding visualizations to get their messages out.
In this guide, we’ll aim to rectify these mishaps by sharing examples, clarifying when you should (and shouldn’t) use a stacked bar chart, and discussing best practices for stacking bars.
Preorder from your preferred retailer, or place an order with your local bookseller.
Packing a suitcase and preparing a presentation deck are surprisingly similar.
The lesson: take a few moments to declutter and focus attention when designing graphs to communicate to others. These simple steps will lead to better graphs—and better communication.
I’ve found it helpful to have a checklist of some of my most common chart changes handy. That way, even when time is tight, I can quickly run down my list and make sure that I haven’t forgotten to apply some simple change that could elevate my graph from “passable” to “amazing.”
Here are some charts that use this technique effectively, making it clear where an audience is meant to focus.