Randy KrumDesigner | Author | Instructor | Speaker

Randy Krum

Designer | Author | Instructor | Speaker


Cool-Infographics-Book-Cover-White.jpg

FREE Sample Chapter

an accessible makeover

an accessible makeover

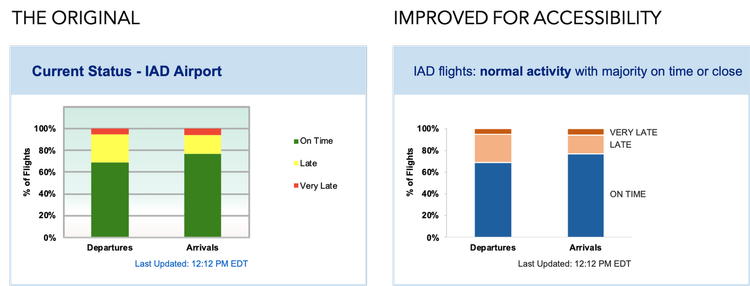
We share data visualization makeovers to illustrate how seemingly minor changes can make data more accessible. Without additional context, the word “accessible” can take on a couple of meanings. “Creating graphs that are easy to understand” is one interpretation. Another is “designing charts that support people with various disabilities.”

Read more: an accessible makeover — storytelling with data

Embracing Mobile to Make Your Data Visualizations More Equitable

Embracing Mobile to Make Your Data Visualizations More Equitable

Information is Beautiful Awards 2022

Information is Beautiful Awards 2022