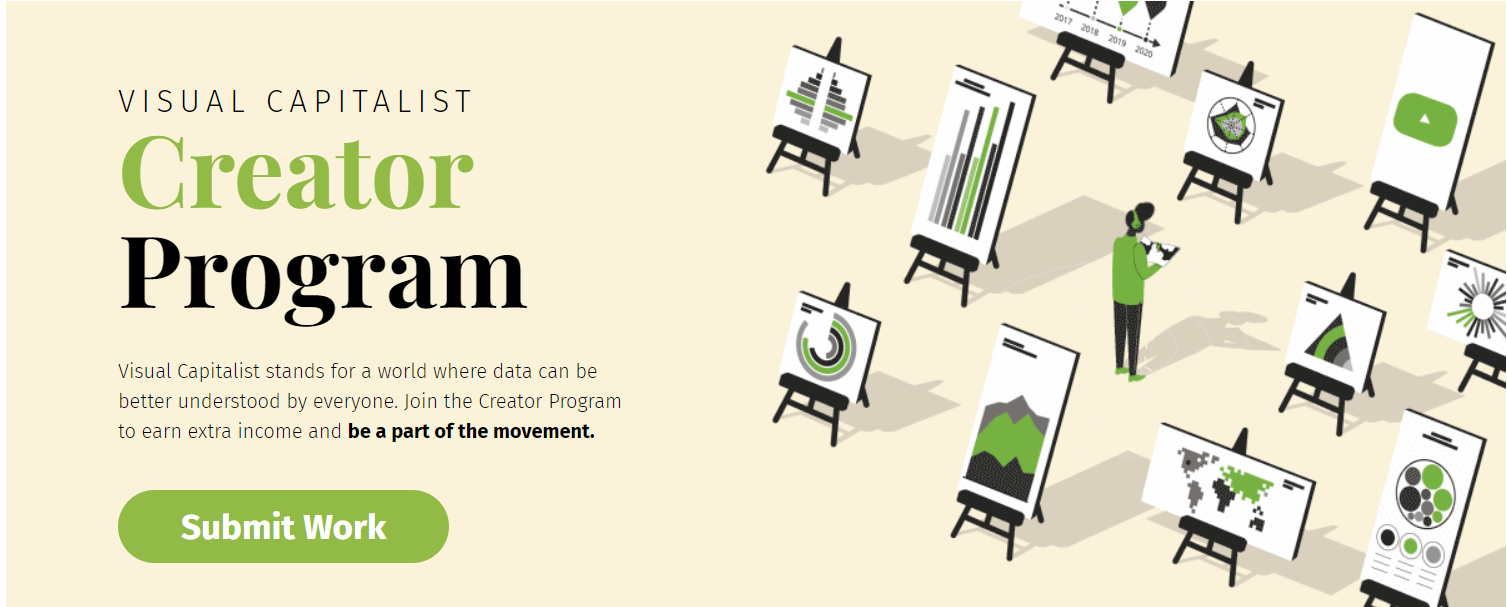
Submit your work!

All tagged Design
Submit your work!
Read our tips about how to make your presentation designs more visually powerful, using PowerPoint, Google Slides and more
Learn icon design basics in Adobe Illustrator from French Graphic Designer Adrien Coquet.
ThingLink has announced an integration with Canva, the global visual communications platform.
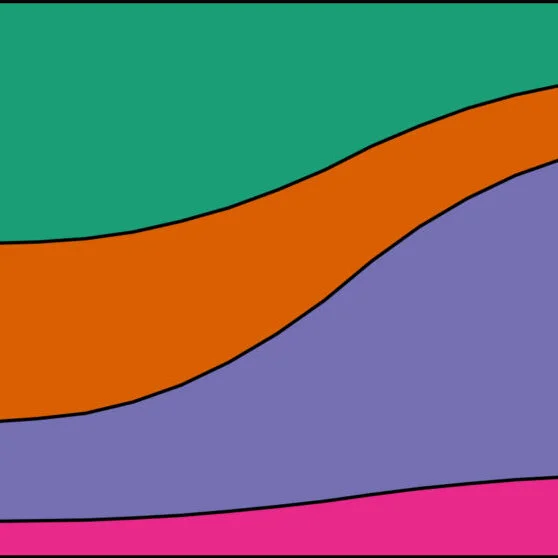
From Stephanie Evergreen: Proportion plots help us compare the share of a population between two metrics. It uses length on the left and right side of the chart and connects the lengths by a band in the middle that swoops a lot if there is disproportionality and stays pretty even if the proportions are the same.
Designing information visualizations offers you endless possibilities when it comes to end products and it would be impossible to provide step-by-step instructions for all these possibilities. However, it is fair to say that while the end products may vary dramatically – the process by which we reach the best possible end product is consistently the same.