Explore the Proportion Plot

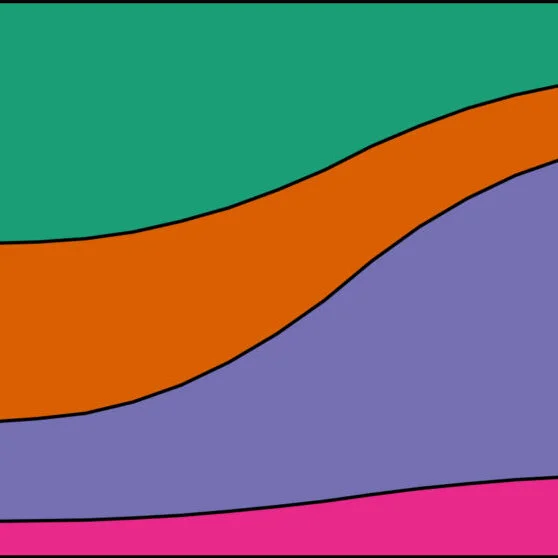
From Stephanie Evergreen: Proportion plots help us compare the share of a population between two metrics. It uses length on the left and right side of the chart and connects the lengths by a band in the middle that swoops a lot if there is disproportionality and stays pretty even if the proportions are the same.
Randy’s note: This is using a 100% Stacked Area chart in place of a Slope Chart, and making the transitions curved instead of straight lines. Not sure it needed a new name.