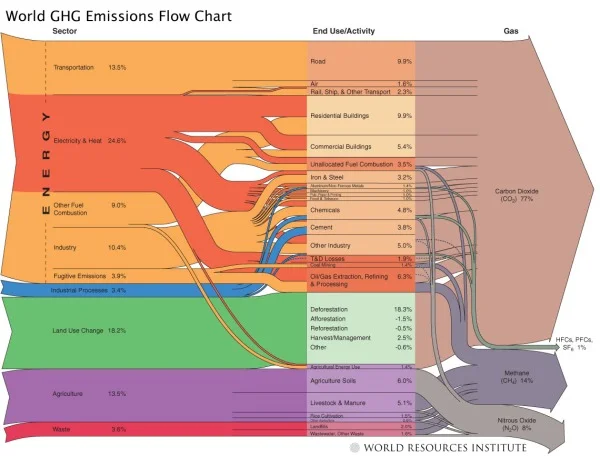
World GHG (Green House Gasses) Emissions Flow Chart

From the World Resources Institute, the World GHG Emissions Flow Chart needs a new name, but shows the composition of GHG (Green House Gasses) emissions and where they come from.
Sources & Notes: All data is for 2000. All calculations are based on CO2 equivalents, using 100-year global warming potentials from the IPCC (1996), based on a total global estimate of 41,755 MtCO2 equivalent. Land use change includes both emissions and absorptions; see Chapter 16. See Appendix 2 for detailed description of sector and end use/activity definitions, as well as data sources. Dotted lines represent flows of less than 0.1% percent of total GHG emissions.
They also have this one for just U.S. GHG emissions: