


Marriage vs Divorce Rates by U.S. State
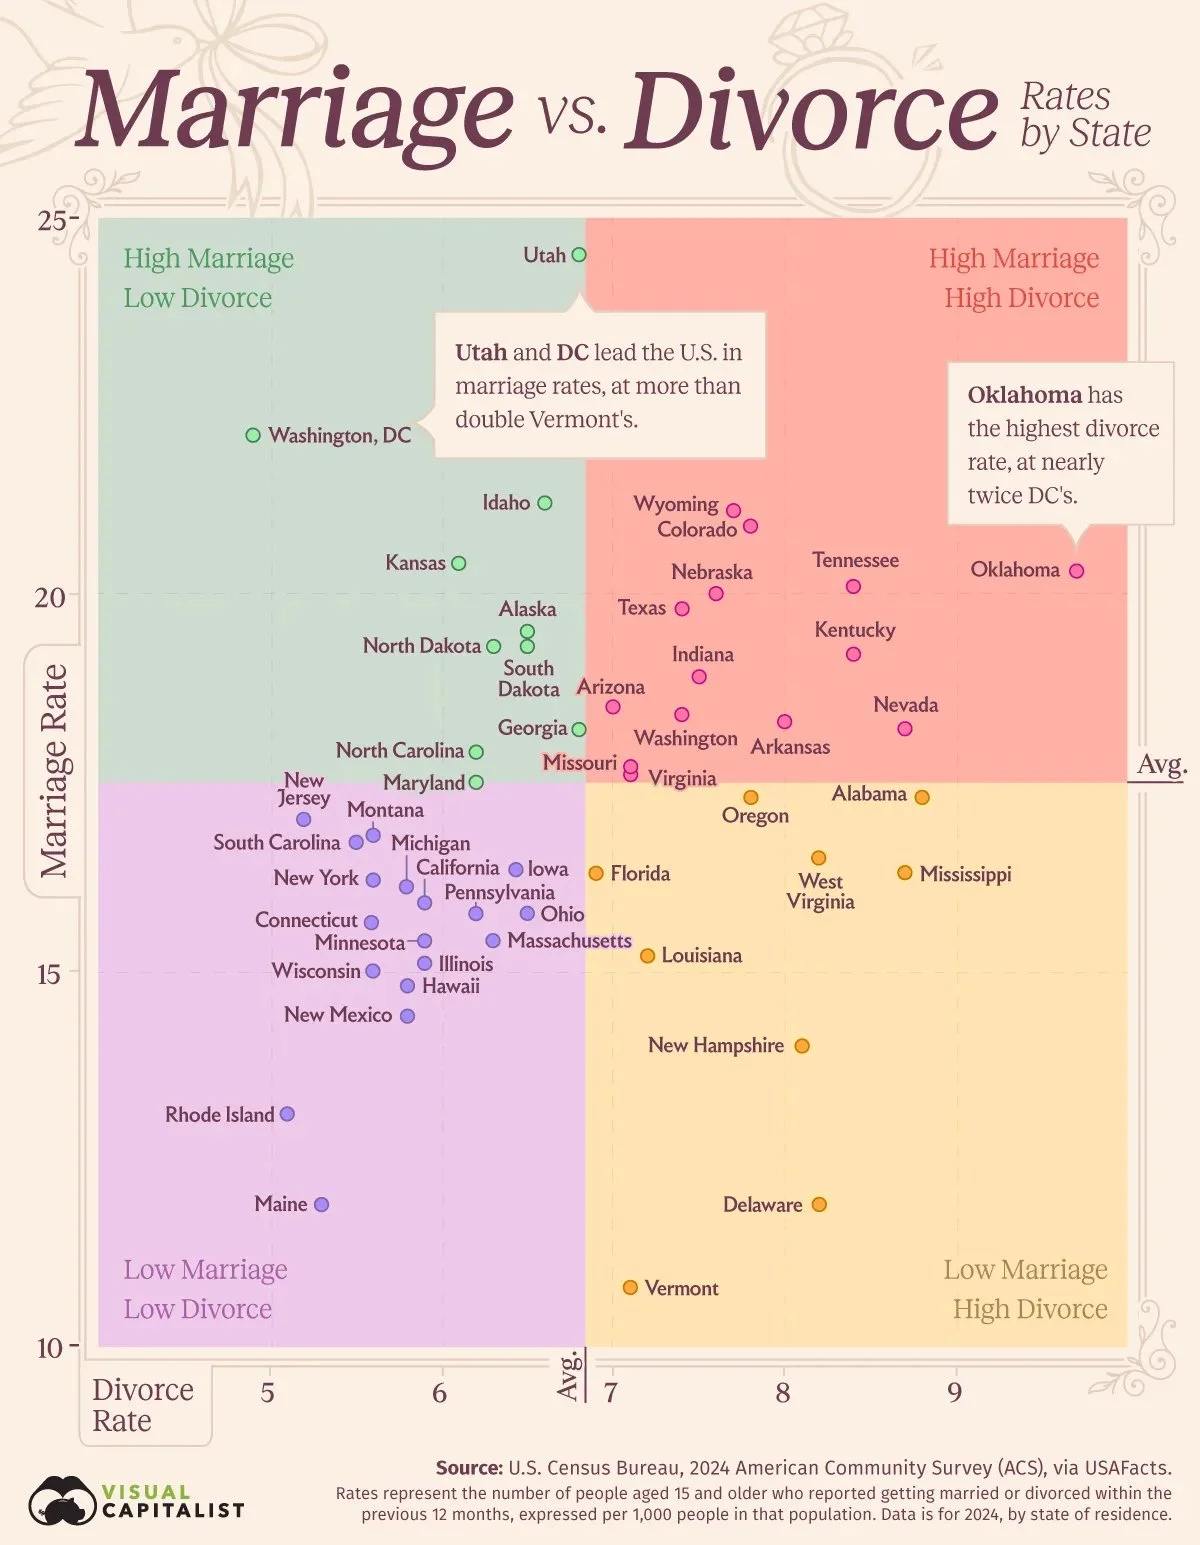
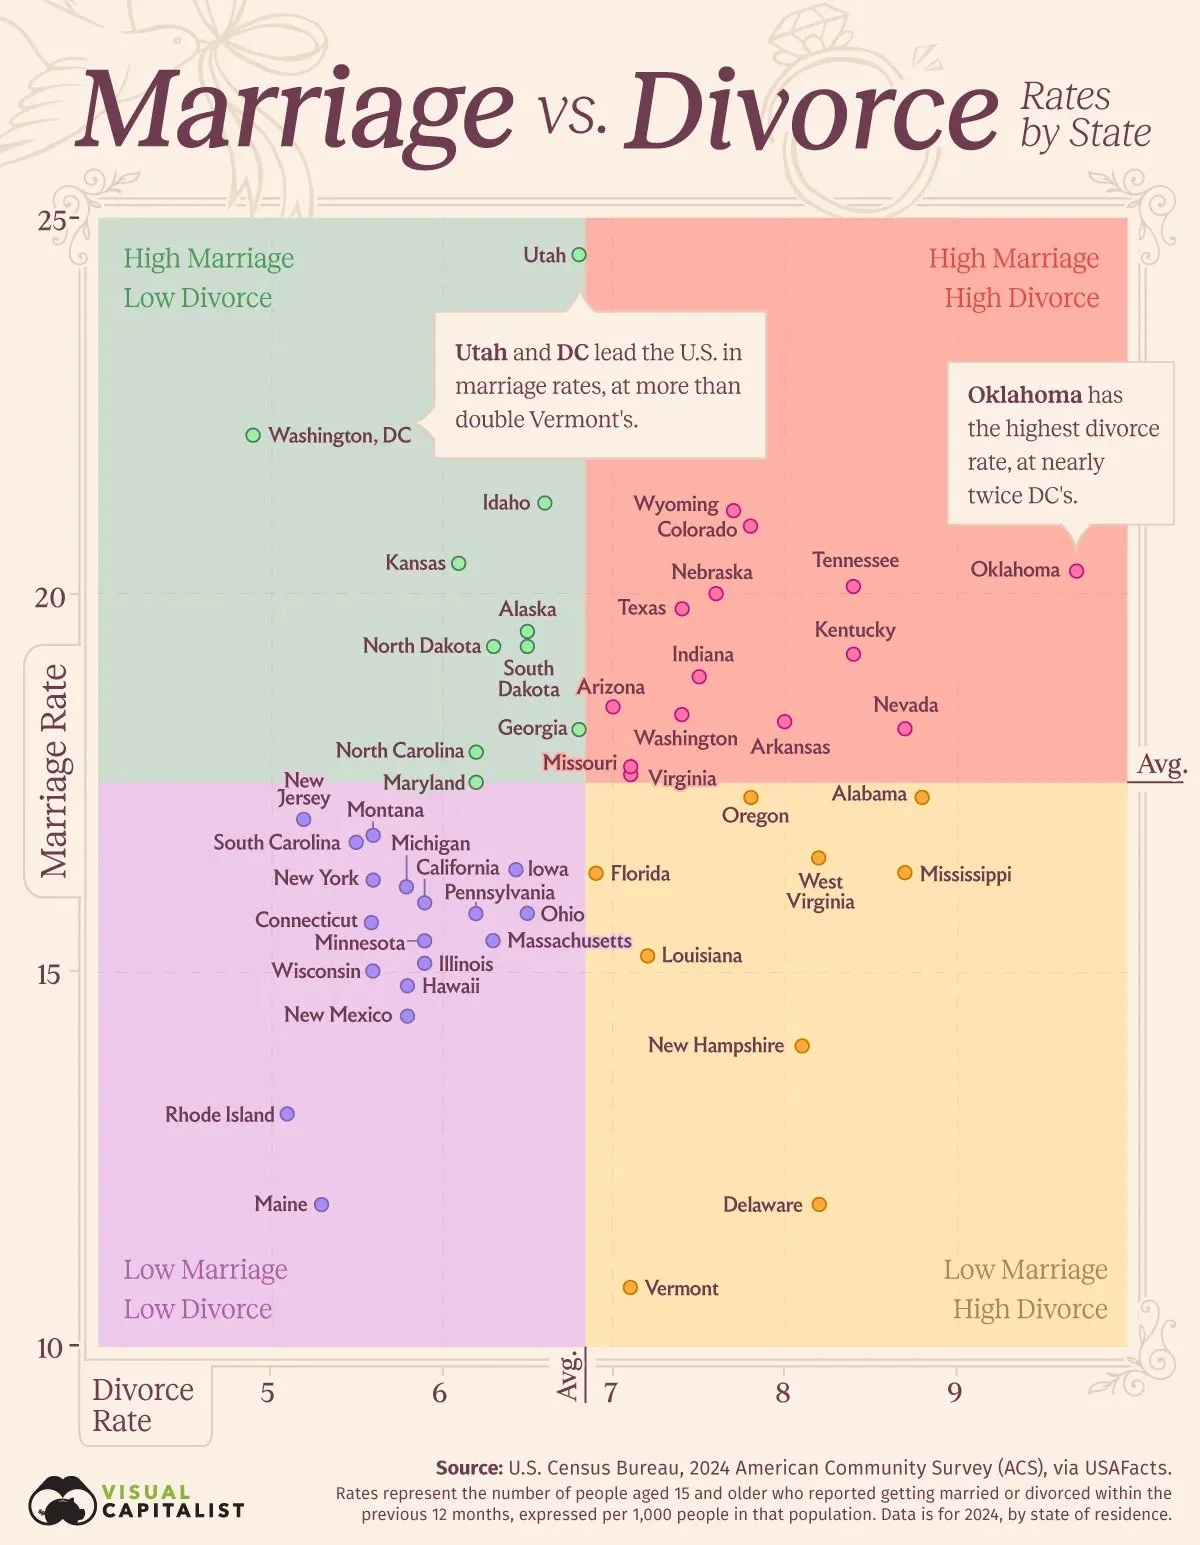
The Marriage vs Divorce rates by state infographic by Visual Capitalist uses a quadrant chart to compare marriage and divorce rates across the US. The results can be interesting as states with higher marriage rates don't necessarily experience more divorces, suggesting that regional culture, demographics, and attitudes toward marriage may play a bigger role than simply how often people tie the knot.
The design choice here is interesting, because the four quadrants are not equal squares. The quadrants are split at the averages of Marriage Rate of 17.3 for the y-axis and Divorce Rate of 6.8 for the x-axis. You can barely see the vertical dotted line at Divorce Rate 7.0 where the true halfway point is.. TIP: You can trick Excel and PowerPoint to create a quadrant chart by customizing an X-Y scatter plot.
How Marriage and Divorce Rates Compare Across U.S. States
Key Takeaways:
Utah had America’s highest marriage rate in 2024, at 24.5 marriages per 1,000 residents aged 15 and older.
Oklahoma recorded the highest divorce rate, at 9.7 per 1,000, while Washington, D.C. had the lowest at 4.9.
High marriage rates don’t necessarily mean high divorce rates, with states showing very different patterns.
Where are Americans most likely to get married or divorced?
The answer reveals striking differences between states, including places where both marriage and divorce are relatively common and others where both are comparatively rare.This graphic uses the U.S. Census Bureau’s 2024 American Community Survey, via USAFacts, to compare marriages and divorces reported over the previous 12 months per 1,000 residents aged 15 and older.
Read more at Marriage vs. Divorce Rates, by U.S. State