


Drowning in Plastic

Simon Scarr and Marco Hernandez at Reuters created Drowning in Plastic, visualizing the amount of plastic bottles we consume, recycle and throw away every hour, day, month, year and decade.
Around the world, almost 1 million plastic bottles are purchased every minute. As the environmental impact of that tide of plastic becomes a growing political issue, major packaged goods sellers and retailers are under pressure to cut the flow of the single-use bottles and containers that are clogging the world’s waterways.
Plastic production has surged in the last 50 years, leading to widespread use of inexpensive disposable products that are having a devastating effect on the environment. Images of plastic debris-strewn beaches and dead animals with stomachs full of plastic have sparked outrage.
Polyethylene terephthalate (PET) bottles are commonly used for soft drinks and mineral water, but can also be used in other household or personal care products. Data from Euromonitor International, shows that more than 480 billion of these bottles were sold last year alone. That’s almost 1 million every minute, as shown in the animation at the top of this page. The illustrations below show what that pile of plastic would look like if it was collected over a longer period of time.
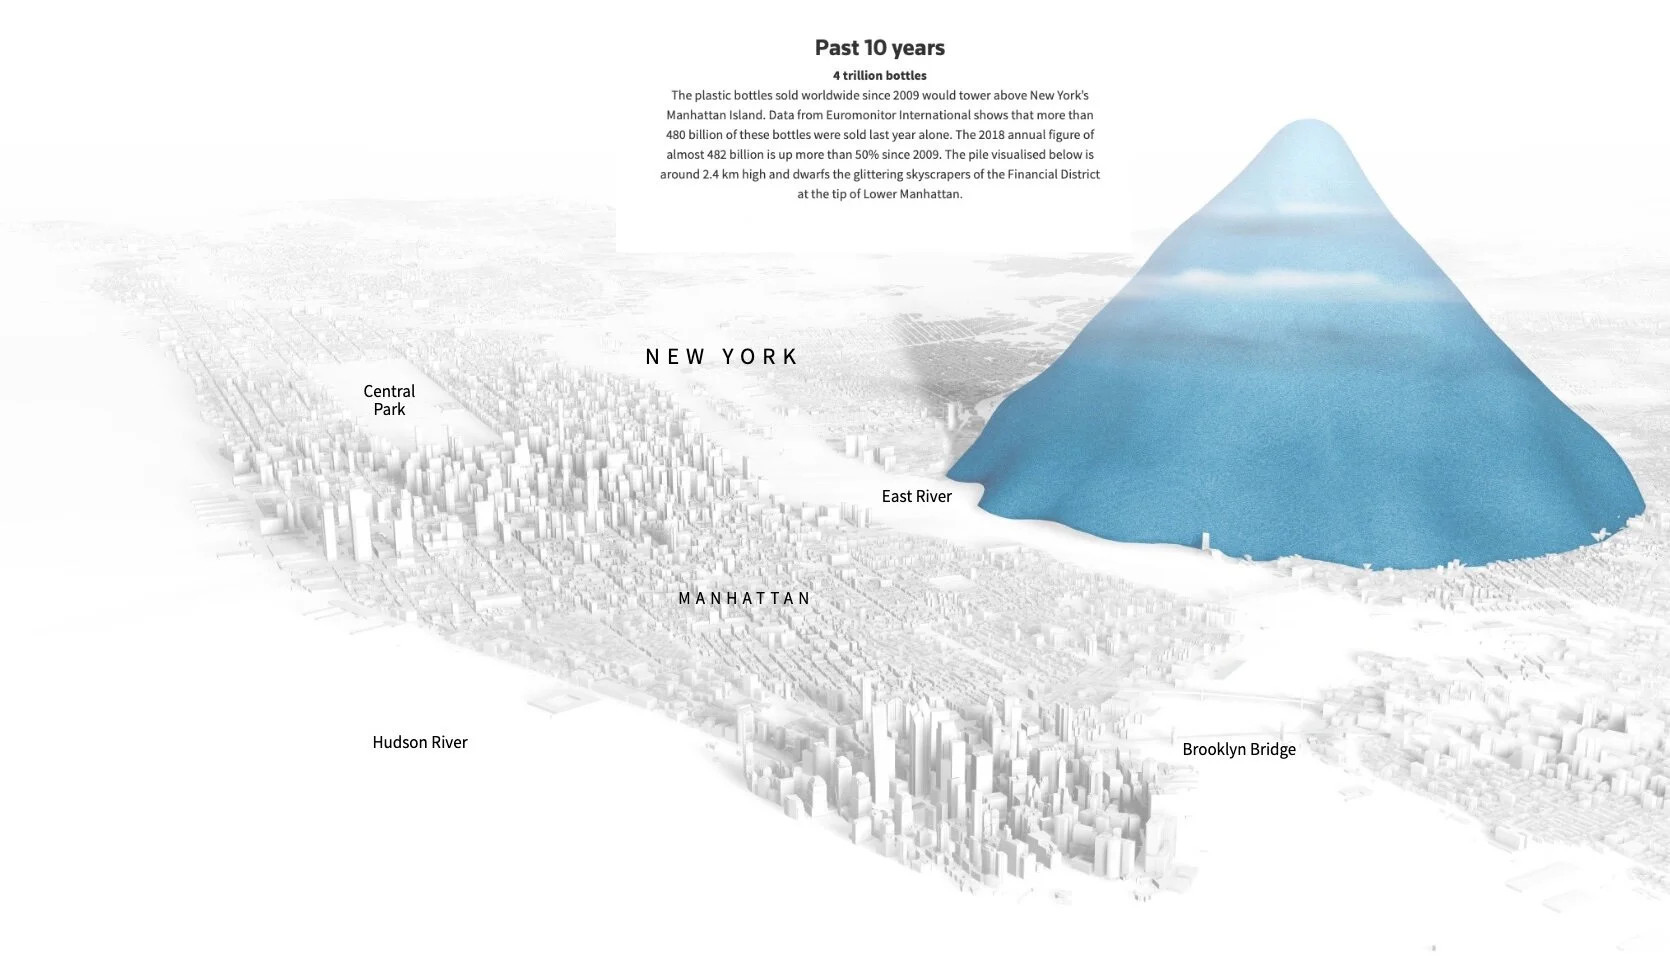
The visuals of massive piles of plastic bottles next to recognizable landmarks helps provide context and scale to readers.
They also provided a nice Sankey Diagram showing the fate of most plastic bottles is to end up in the landfill.

Found on FlowingData


![US/China Trade Infographic [Making-of Video]](https://images.squarespace-cdn.com/content/v1/5bfc8dbab40b9d7dd9054f41/1552506405646-O1MW6JLEYAXCPKE1OHL2/us-chinatradecomparison-2.jpg)